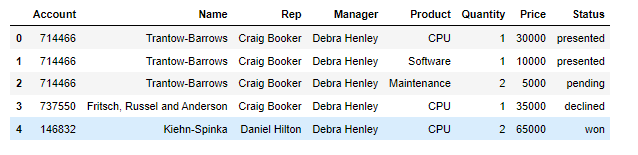
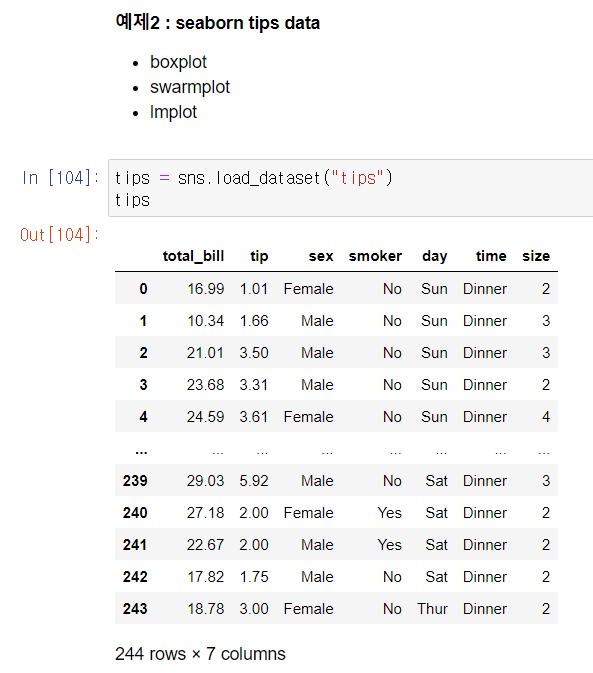
📌 데이터 개요
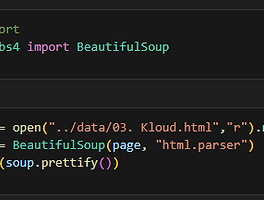
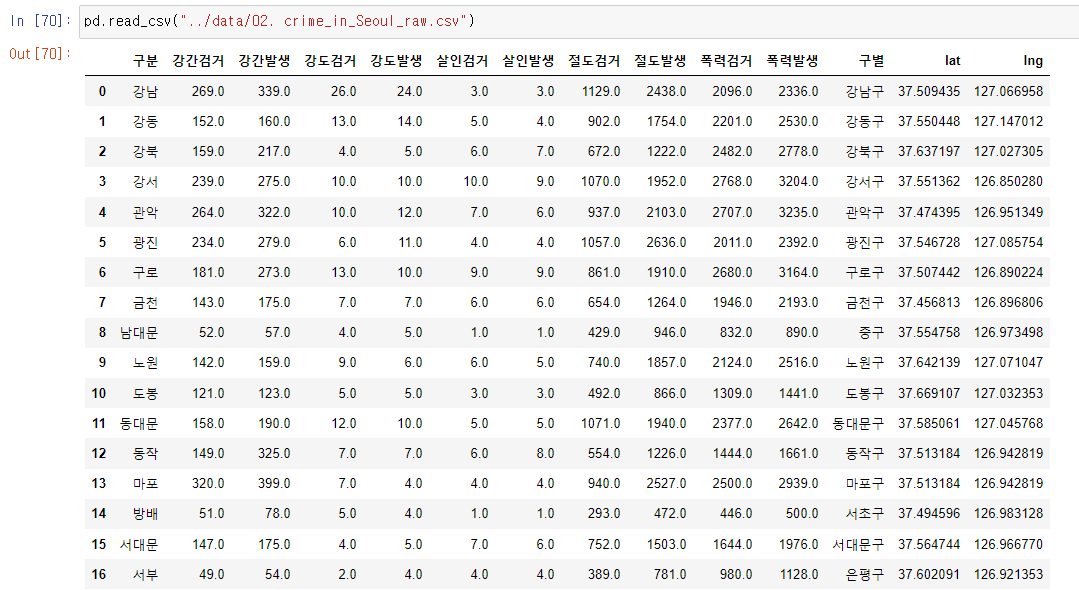
🚩 Data 불러오기
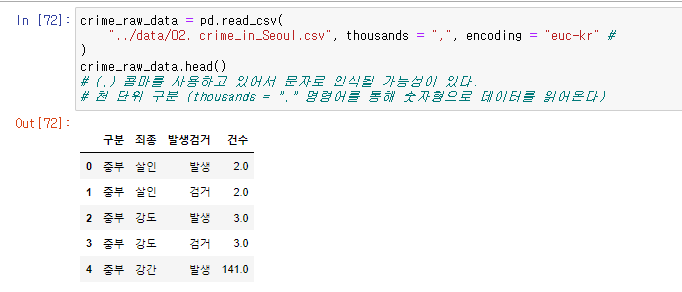
- thousands 명령어
- (,)를 사용하고 있어서 문자로 인식될 가능성이 있다.
- 명령어를 통해 숫자형으로 데이터를 읽어온다.
🚩 Data Check
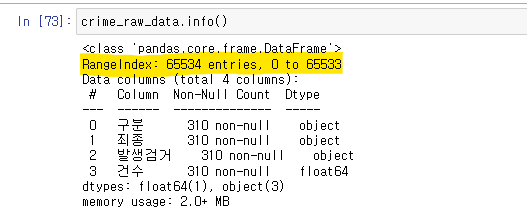
- info() 명령어를 통해 데이터 확인
- Rangeindex를 보니 총 65534개의 데이터가 있다, 확인이 필요!
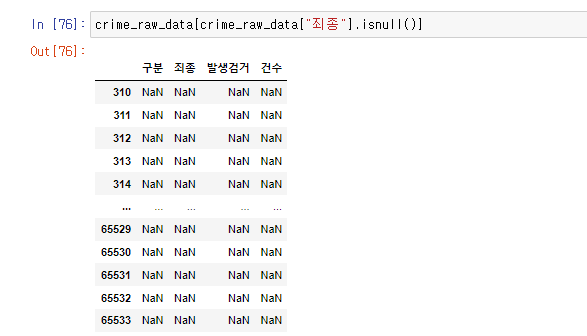
- unique() 함수를 이용해 확인, NaN 데이터 확인

- DataFrame.isnull() 함수로 확인해보니 NaN 데이터가 많다.
- 이를 notnull() 함수로 제거, 데이터가 정리된 것을 확인할 수 있다

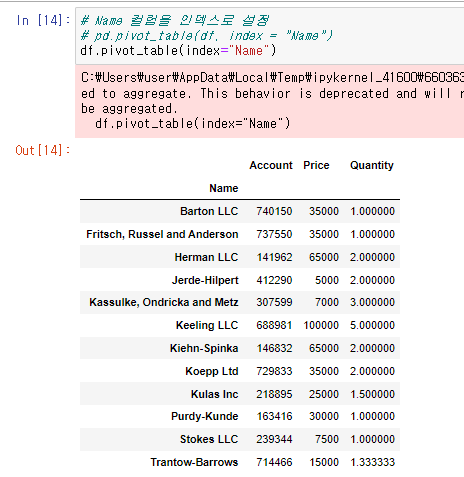
🚩 pivot_table()
- index, columns, values, aggfunc
- margin=True : 총계를 표시
- fill_value : NaN data를 채워준다
- pivot_table() 함수를 이용, index로 설정할 column을 지정 (Name)
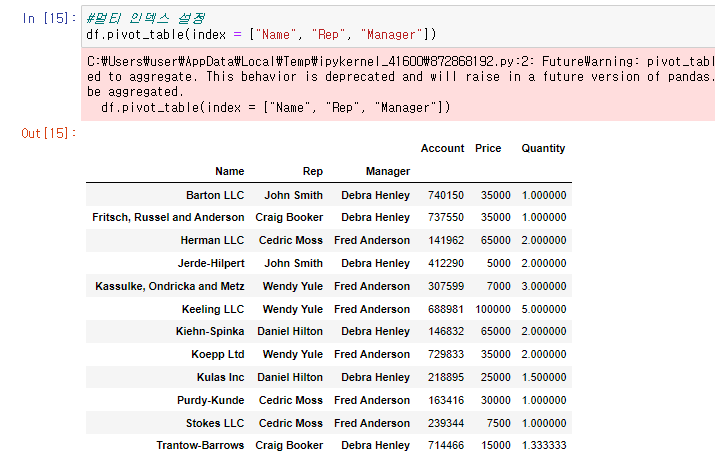
- multi index 설정
- 리스트 안에 column name을 작성
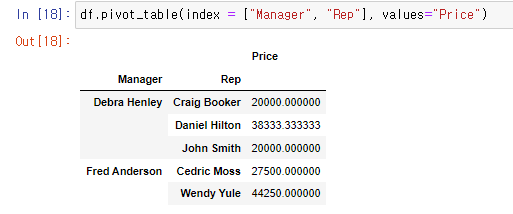
- 실습 try!
- 숫자 데이터를 pivot_table 지정하면, 자동으로 평균값으로 pivot
- aggfunc=np.sum 함수로 Price 값을 합연산으로 적용

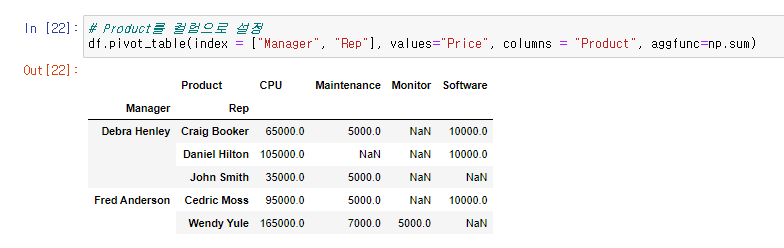
- index, values, columns
- Product를 컬럼으로 설정
- NaN data 처리 필요
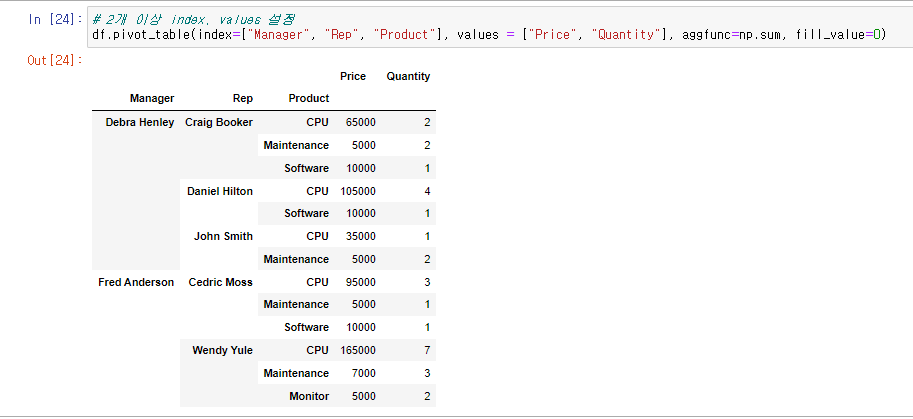
- fill_value로 NaN data를 0으로 처리

- 2개 이상의 values 값 설정
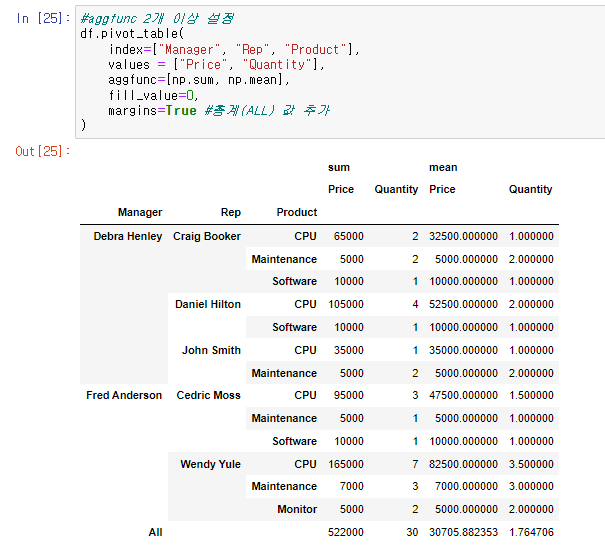
- aggfunc 2개 이상 설정
- margins = True를 통해 총계 값 추가
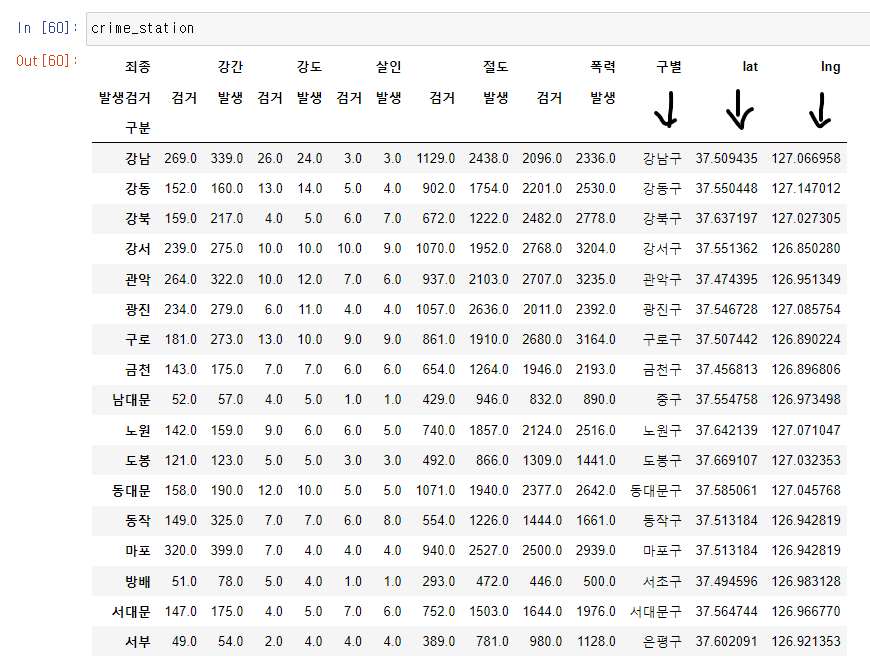
📌 서울시 범죄 현황 데이터 정리
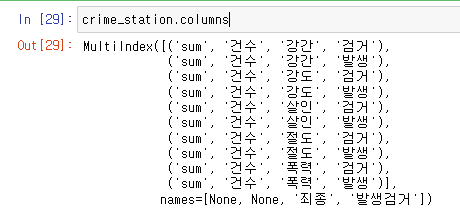
🚩 pivot_table 통해 데이터 정리하기
- index = 구분, columns = 죄종, 발생검거
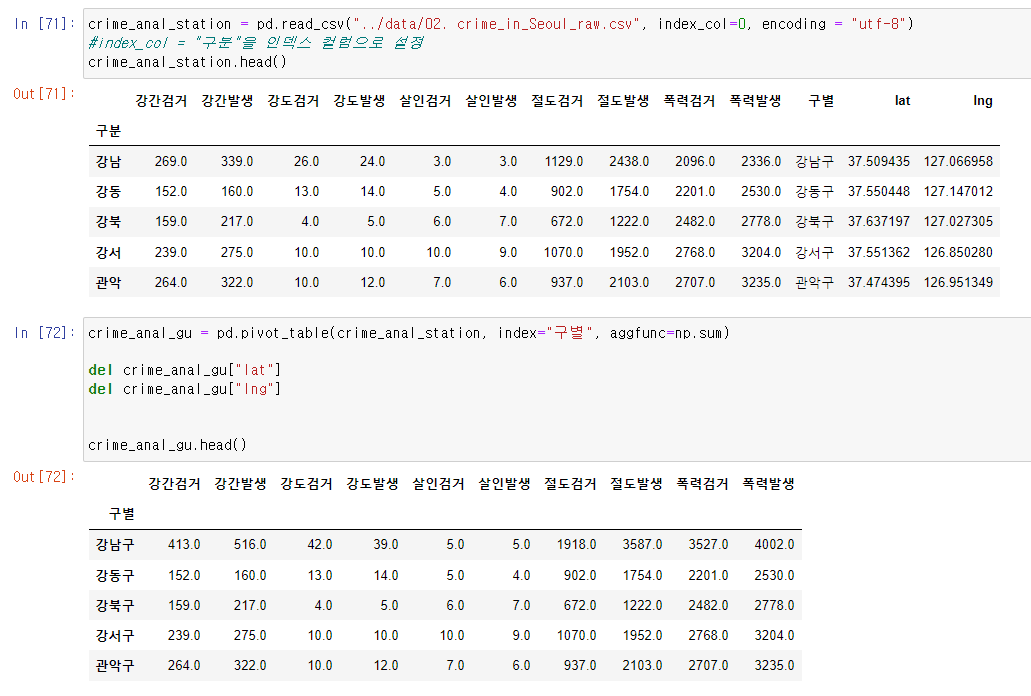
- 지역구(서)를 index로 지정하여 데이터 정제
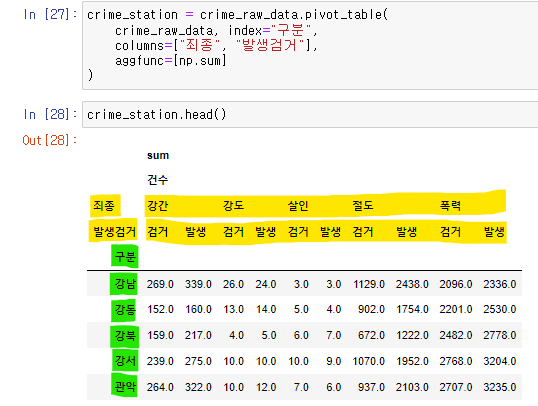
- 멀티컬럼인 것을 확인
🚩 다중 컬럼에서 특정 컬럼을 제거하는 새로운 방법
- data_name.columns.droplevel([n1, n2])
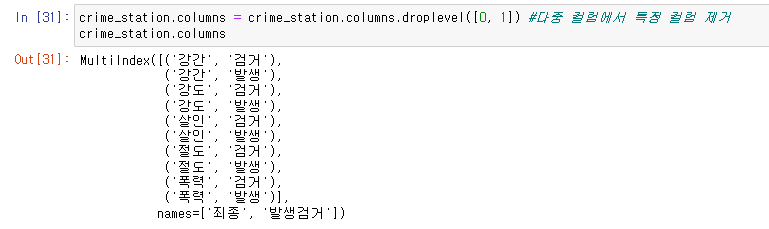
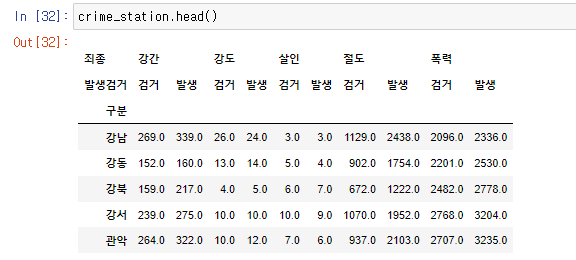
- 정리된 Data 출력
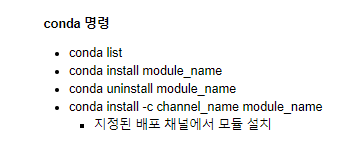
🚩 Pip 명령으로 필요한 모듈을 설치
- !pip list 명령어로 설치되어있는 모듈을 확인할 수 있다

🚩 Google Maps API 설치

- googlemaps를 import
- googlemaps.Client(key="키 값")
- geocode 함수를 이용하여 구글맵 데이터 검색 결과를 가져올 수 있다
- geocode 함수의 길이는 1로 반환된다
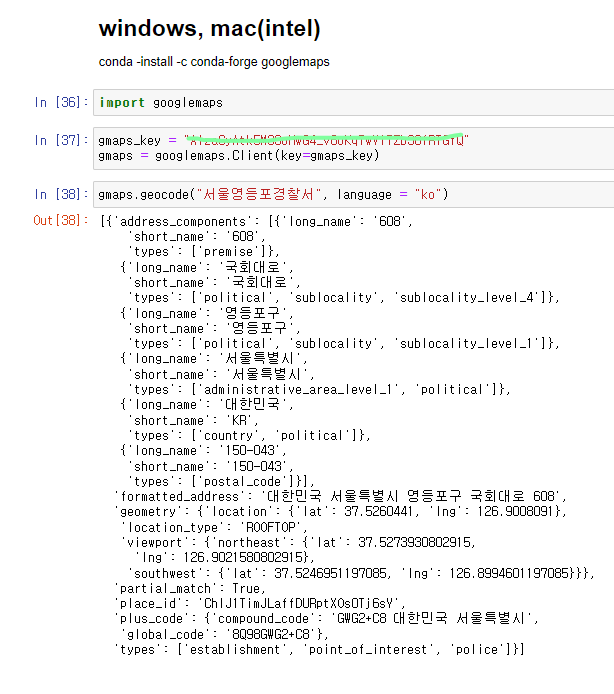
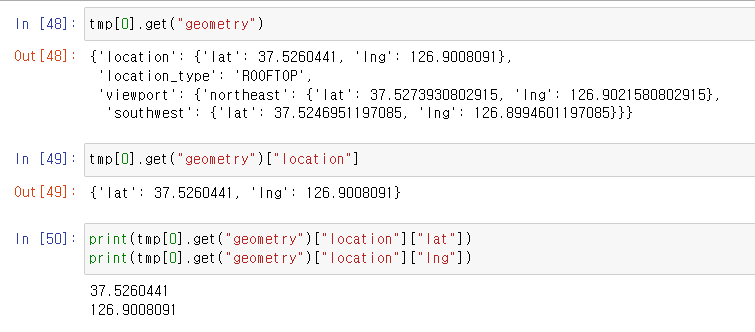
- tmp 변수에 담은 뒤 0번째 index 데이터를 확인

- get 함수로 데이터를 서칭
- 위도와 경도 데이터를 얻을 수 있다
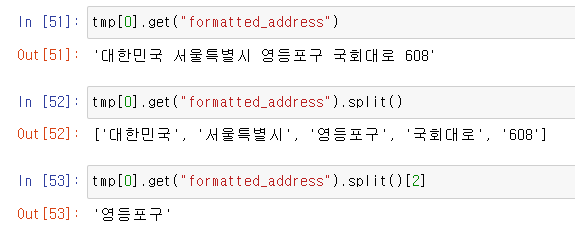
- 주소 데이터 서칭
- split으로 데이터를 슬라이싱
🚩 iterrows() 함수
- Pandas DataFrame은 대부분 2차원 데이터
- Pandas DataFrame으로 반복문을 만들 때, iterrows 함수를 쓰면 편하다
- index, rows 데이터를 반환
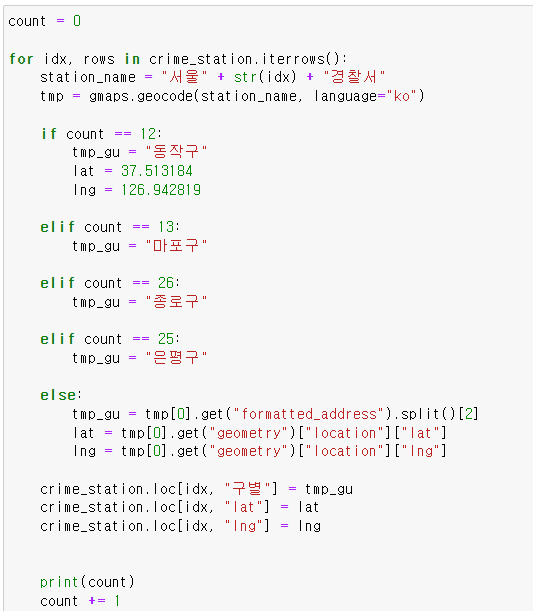
- station_name의 변수를 준다.
- 구글맵에 경찰서 이름을 검색하면 위도와 경도, 주소 데이터가 반환되는 것을 이용 나오는 것을 이용하여
각 경찰서의 위치와 위도, 경도를 추출한다.
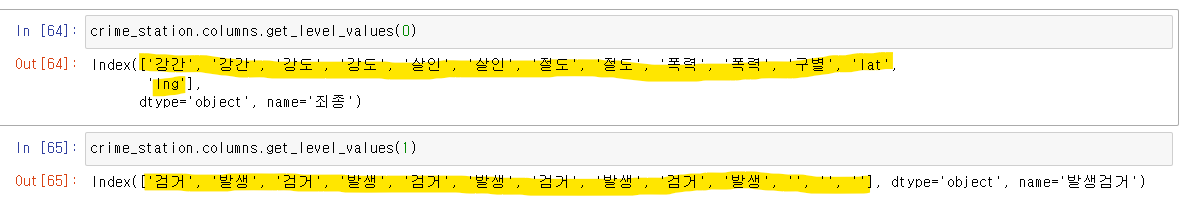
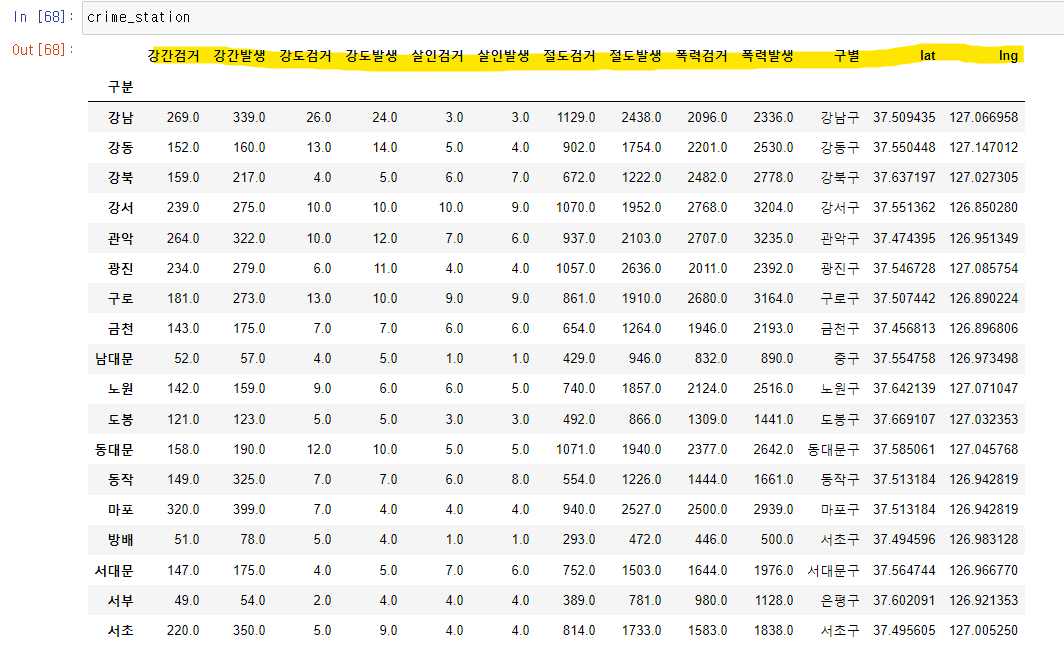
🚩 데이터 컬럼 정리하기
- data_name.columns.get_level_values 함수 사용
- 각 데이터 컬럼들의 값을 구해준다
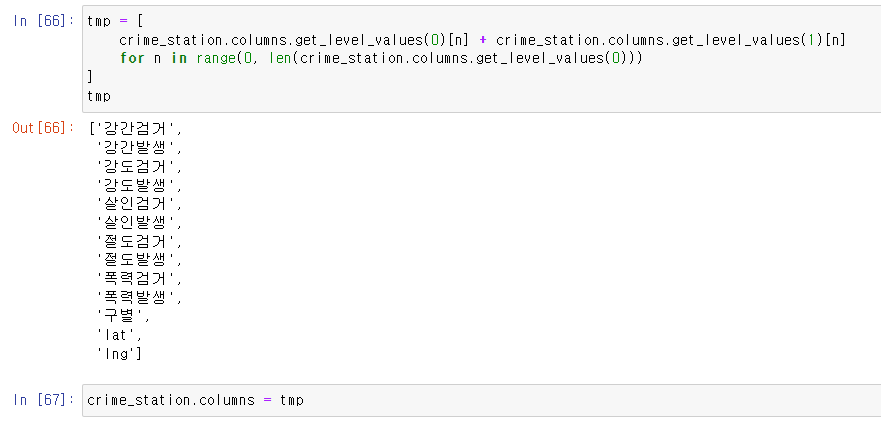
- 각 컬럼을 for문을 통해서 합쳐준 후, 저장
🚩 구별 데이터로 정리
- 구했던 DataFrame 확인 후 index_col 옵션으로 구분 데이터를 index로 바꿔준다.
- 경찰서 이름 데이터를 구별 데이터로 정리
- 필요없는 컬럼 제거 (lat, lng)
🚩 다수의 컬럼을 나누기
- data_frame[["column1", "column2"]].div(data_frame["column3"], axis = 0) #axis = 0 : 가로
- div함수로 다수의 컬럼을 나눌 수 있다

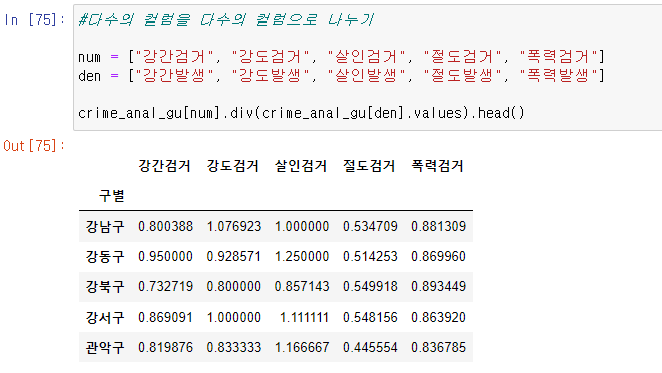
- 각 컬럼을 나눠주어 확률을 계산한다.

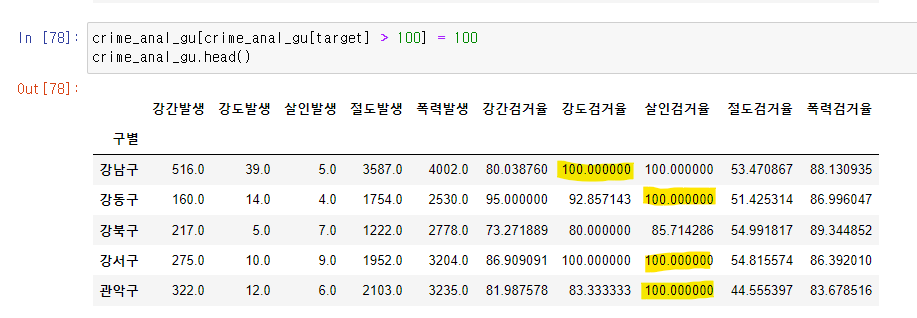
- 각 컬럼의 값이 100이 넘어가는 데이터는 100으로 통일시켜준다
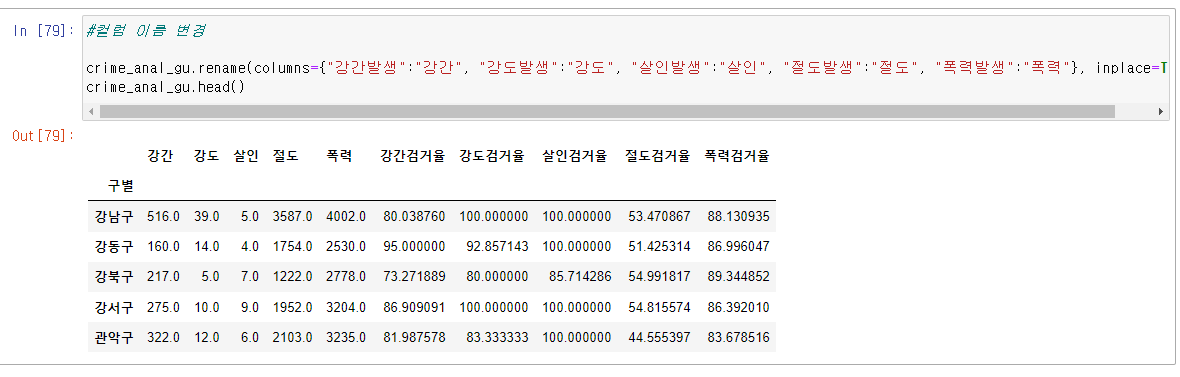
- rename 함수를 이용하여 컬럼 이름을 재정비한다.
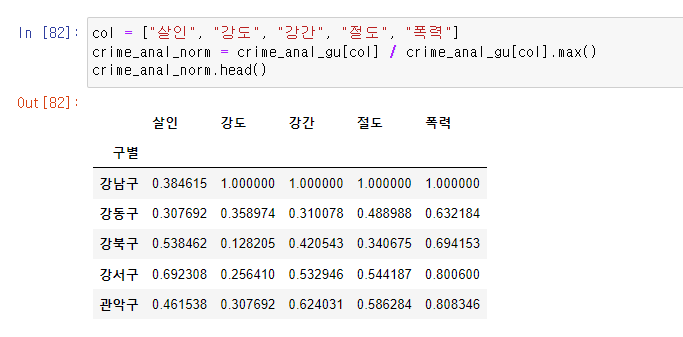
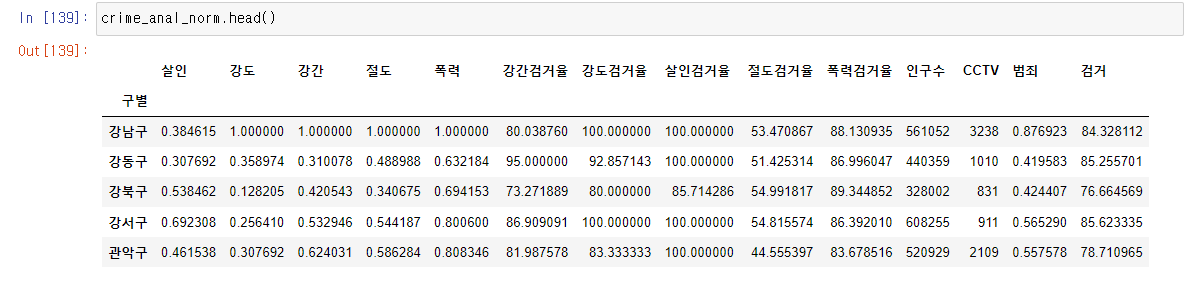
🚩 범죄 데이터 정렬을 위한 데이터 정리 (정규화)
- 정규화 : 최고값은 1, 최솟값은 0
- 기존의 컬럼데이터를 컬럼 데이터 내의 최댓값으로 나눈 값
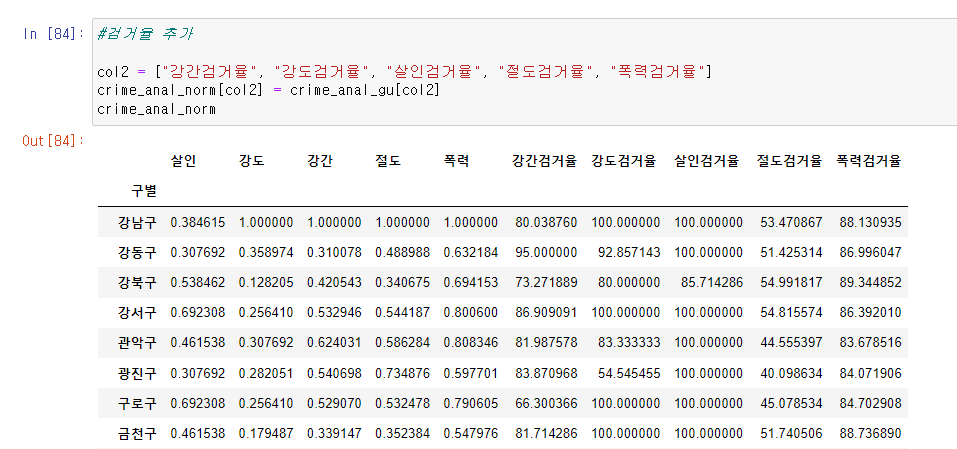
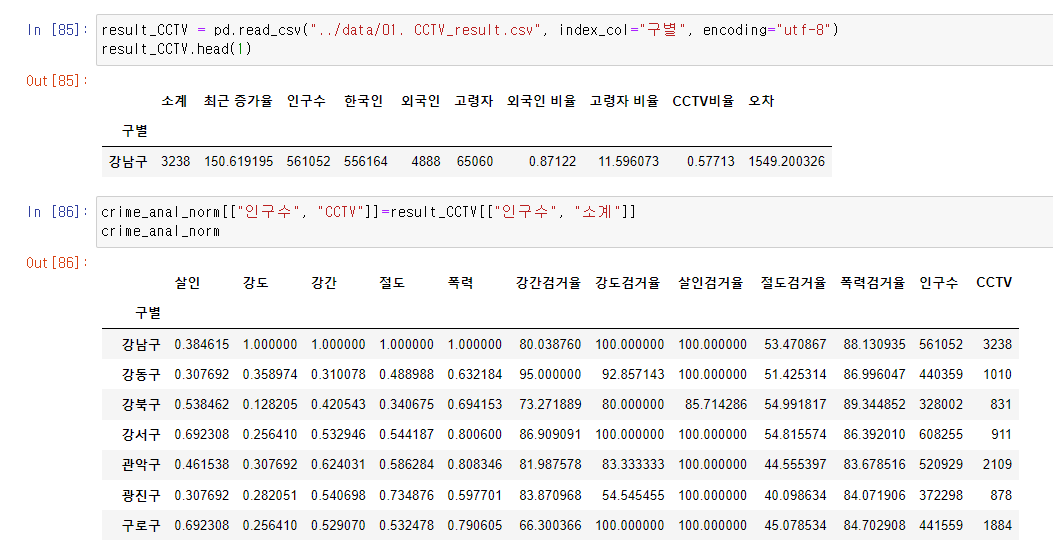
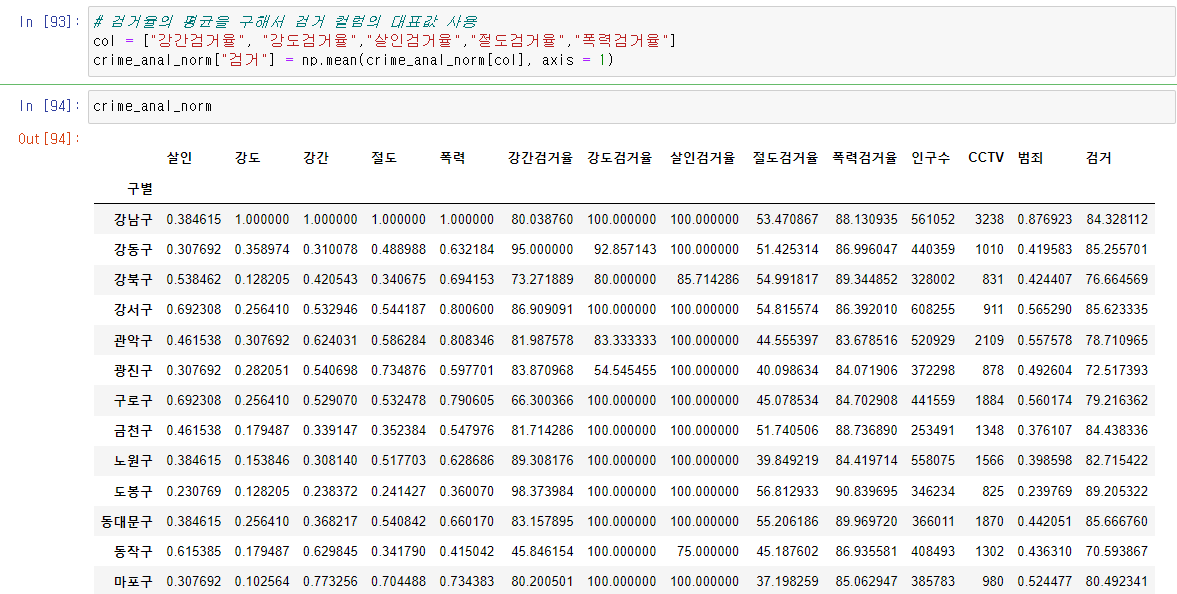
- 정규화된 데이터에 각 죄종의 검거율 컬럼 및 인구수, CCTV(소계) 컬럼추가
- 정규화된 범죄발생 건수 전체 평균을 범죄 컬럼에 추가

🚩 np.mean()
- np.array, np.mean()
- np함수에서는 axis=1 : 행 / axis=0 : 열 (pandas 함수와는 반대)
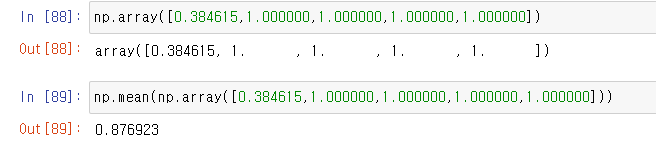
- 2차원 행렬
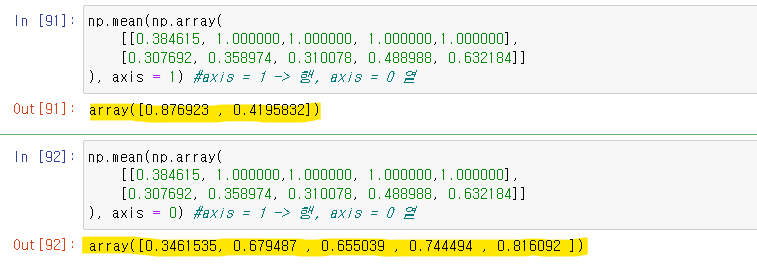
🚩 np 함수를 이용해서 검거율 평균 구하기
🚩 seaborn 기초
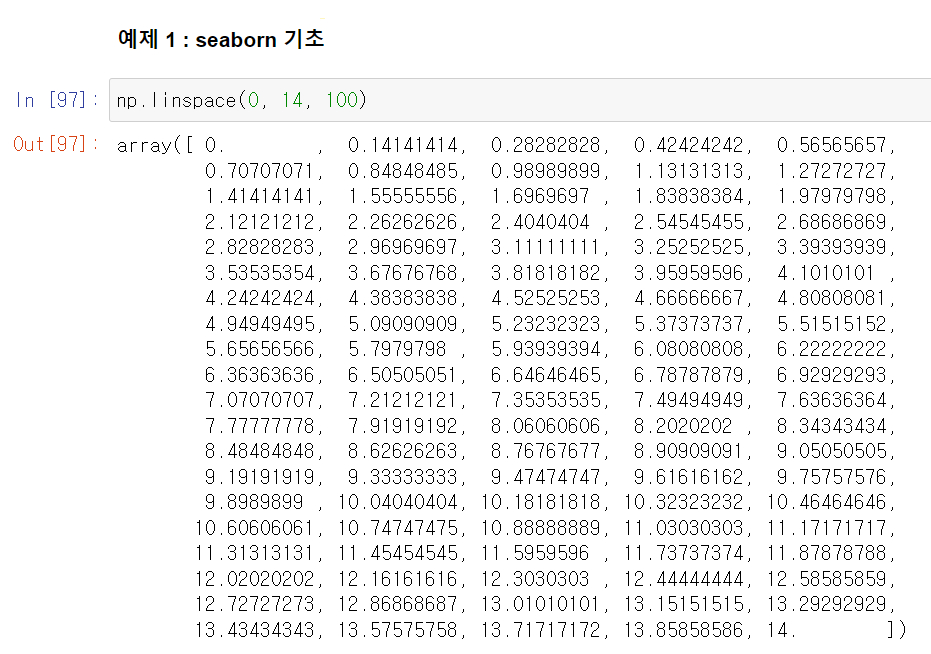
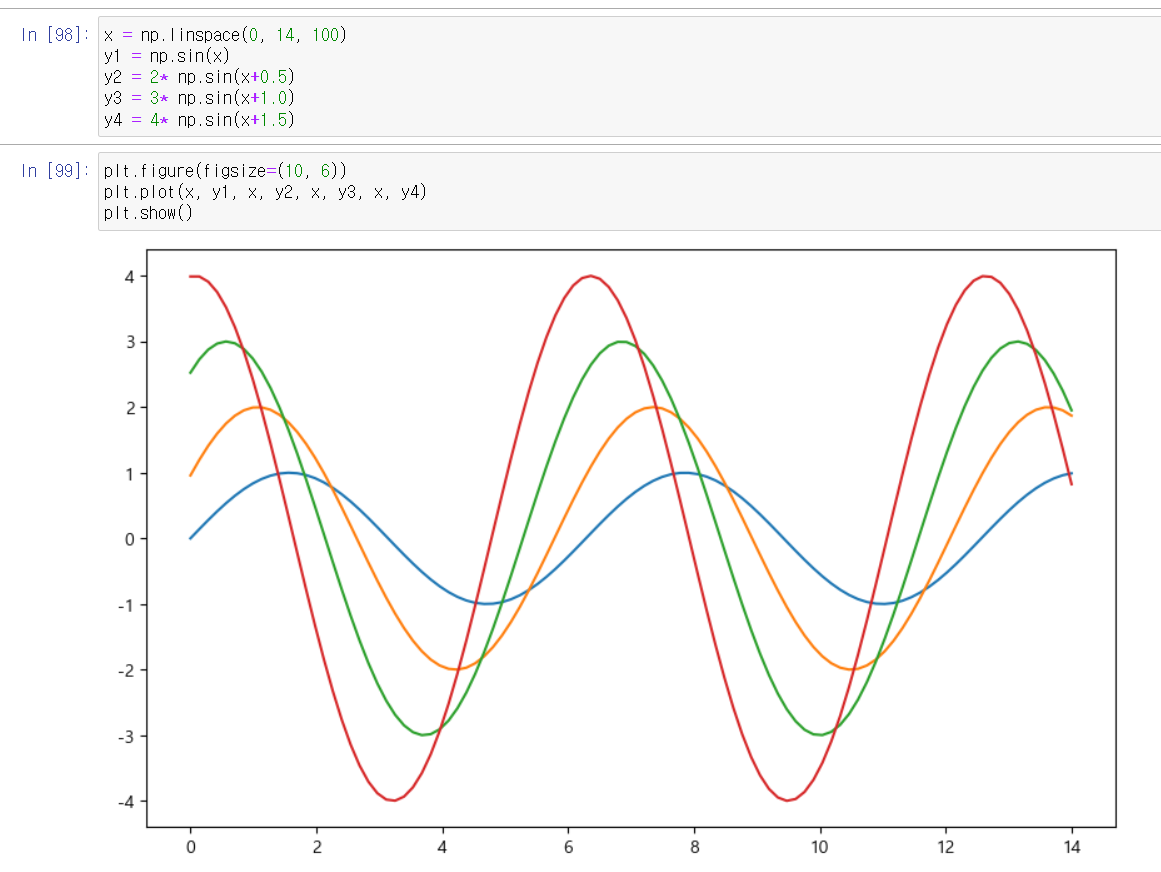
- np.linspace(a, b, s) = a부터 b까지 s개의 등간격 데이터 생성
- sin 함수 만들어보기
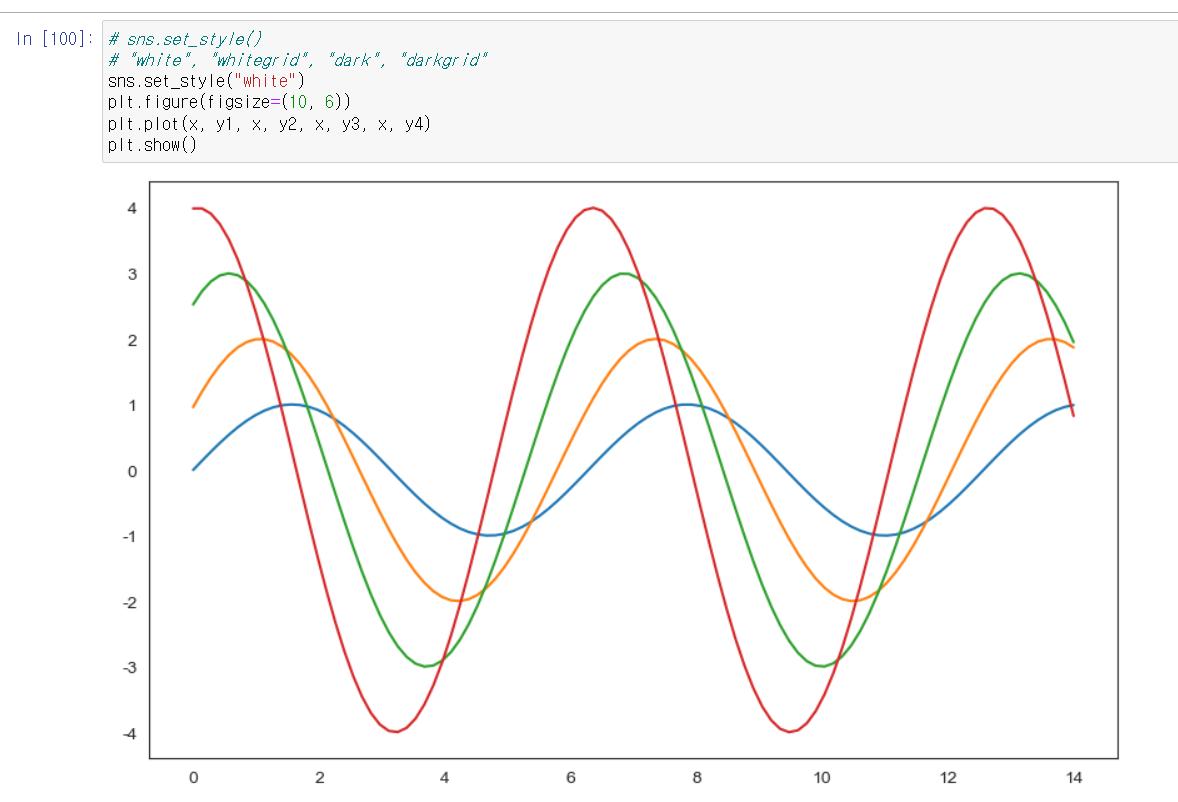
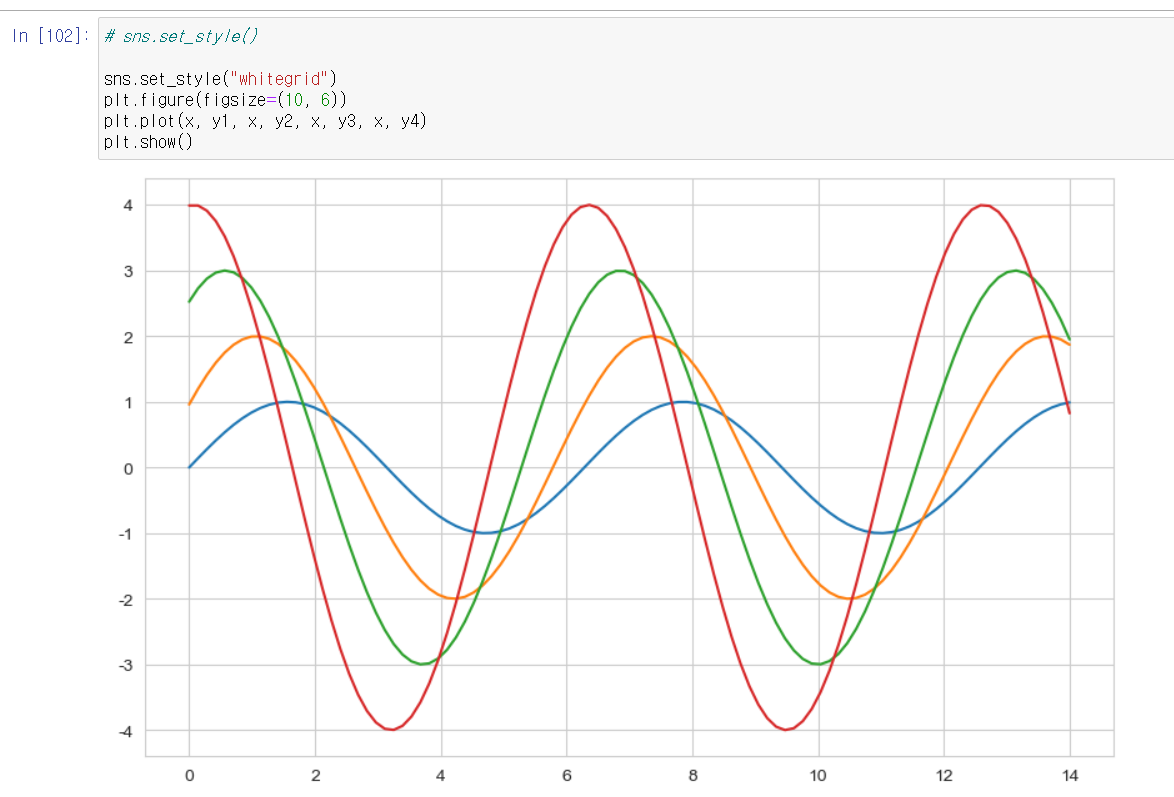
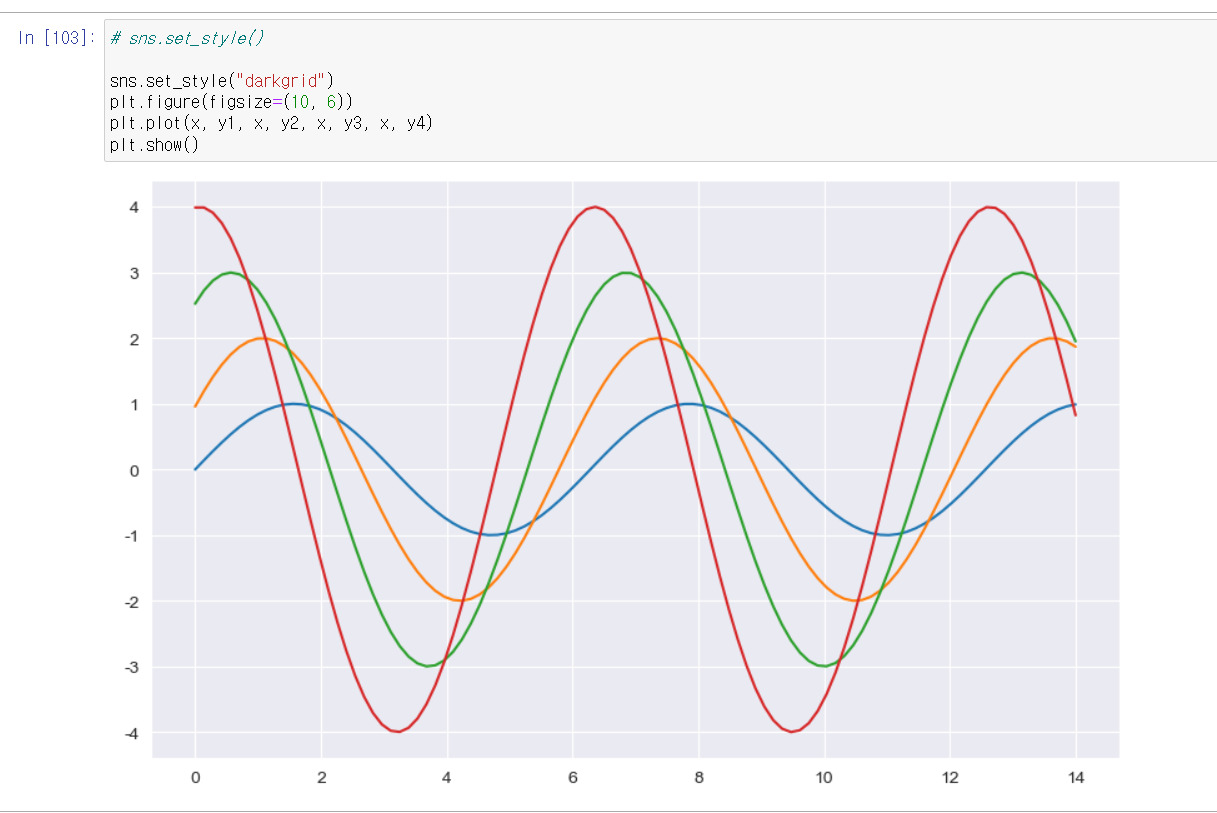
- seaborn 함수 이용하여 그래프 커스텀
- sns.set_style()
- 순서대로 "white", "dark" , "grid",. "darkgrid"

🚩 seaborn 데이터로 다양한 그래프 만들어보기
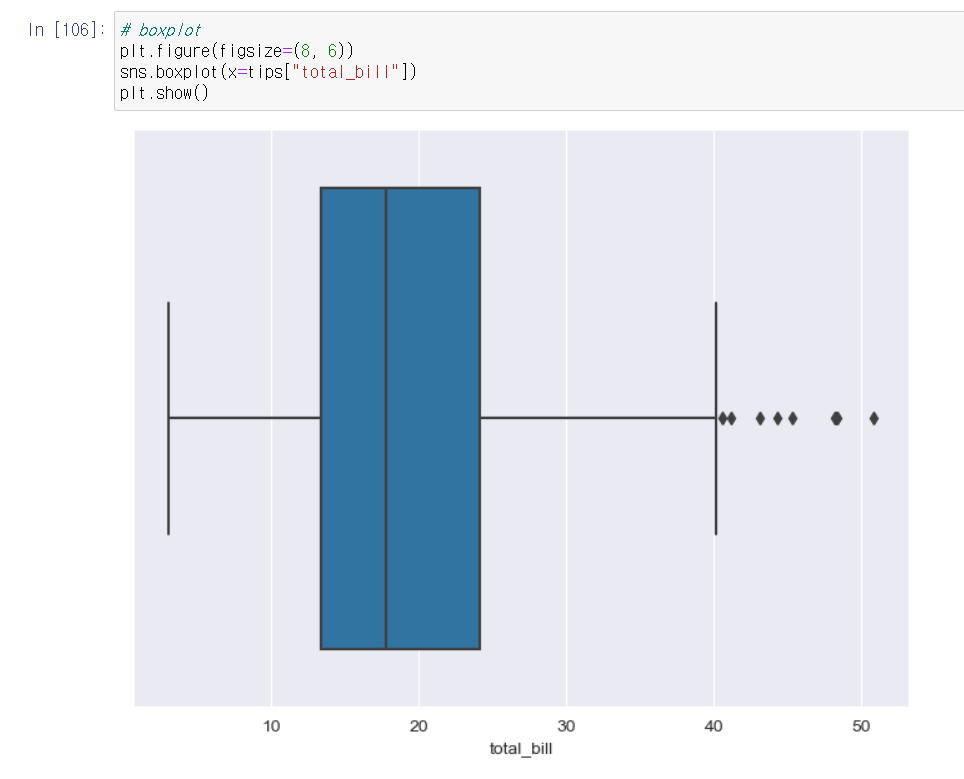
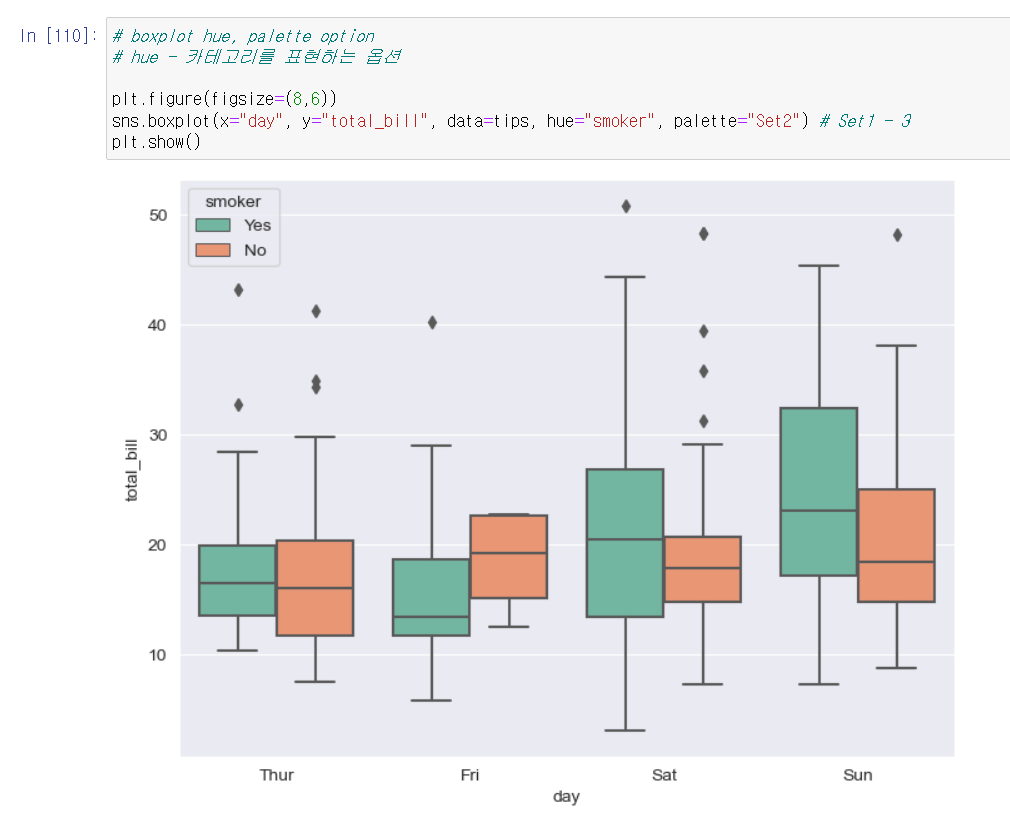
🚩 boxplot
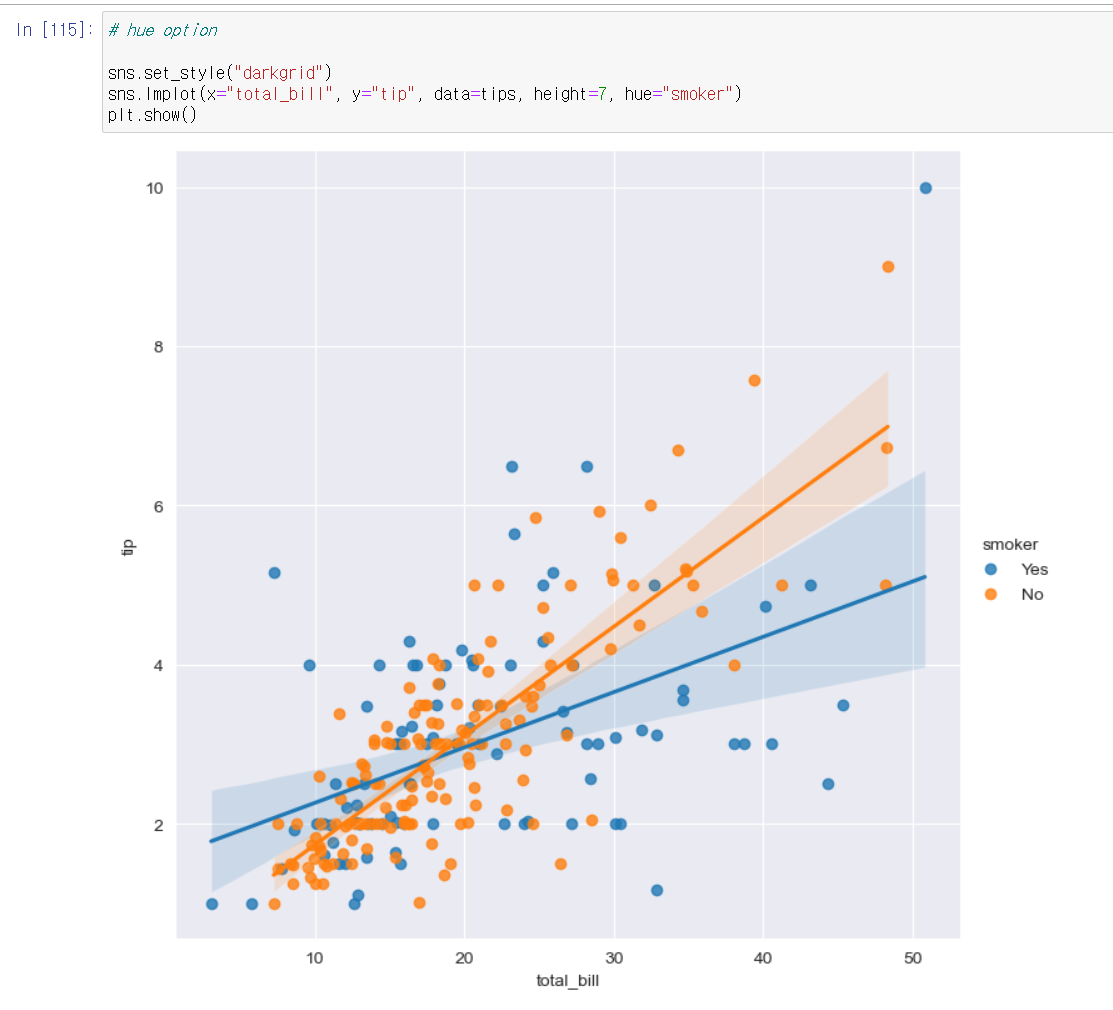
- boxplot hue (카테고리를 표현하는 옵션)
- palette = "Set 1~3" (팔레트 옵션)

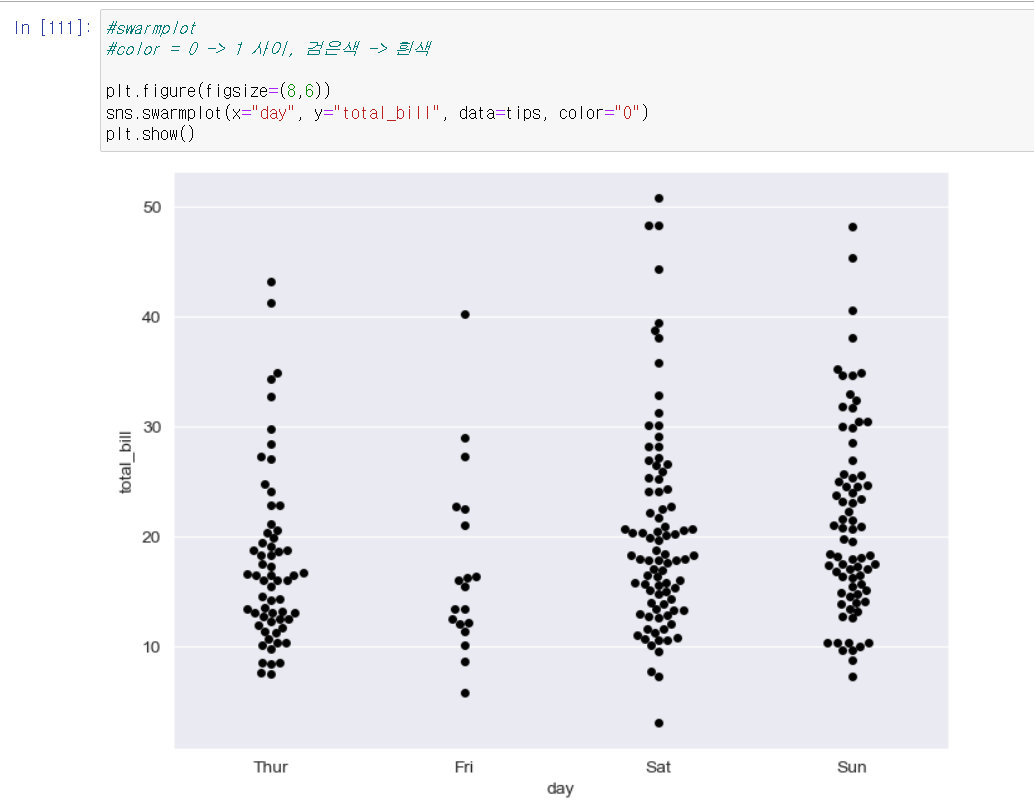
🚩 swarmplot
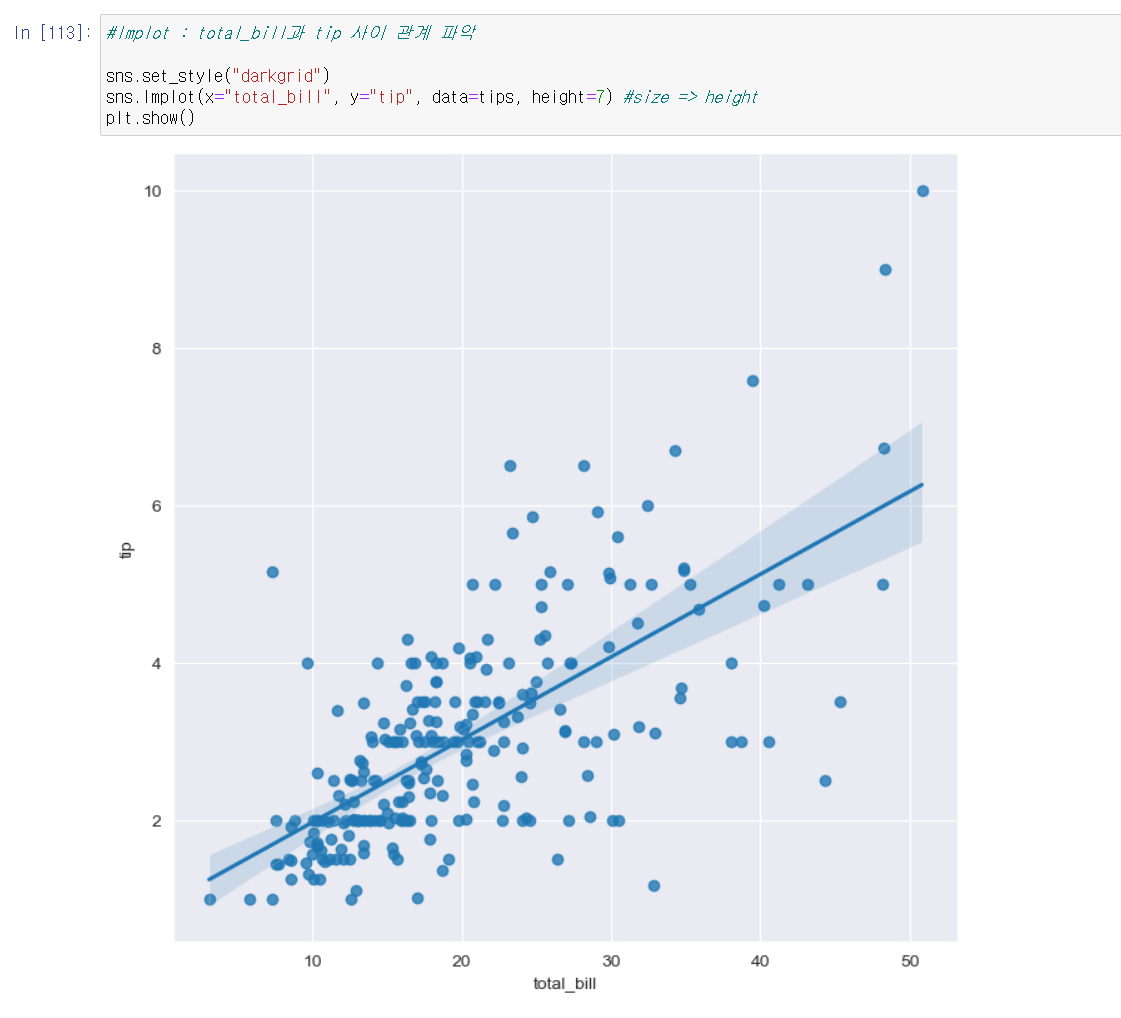
🚩 lmplot
- lmplot 안에 함수 height(size)를 넣을 수 있다
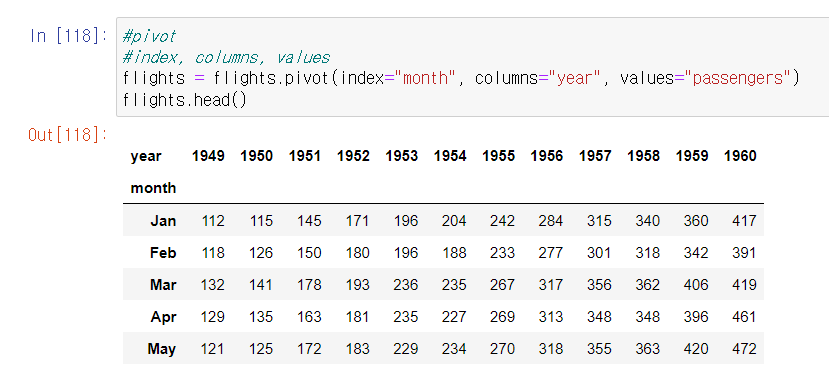
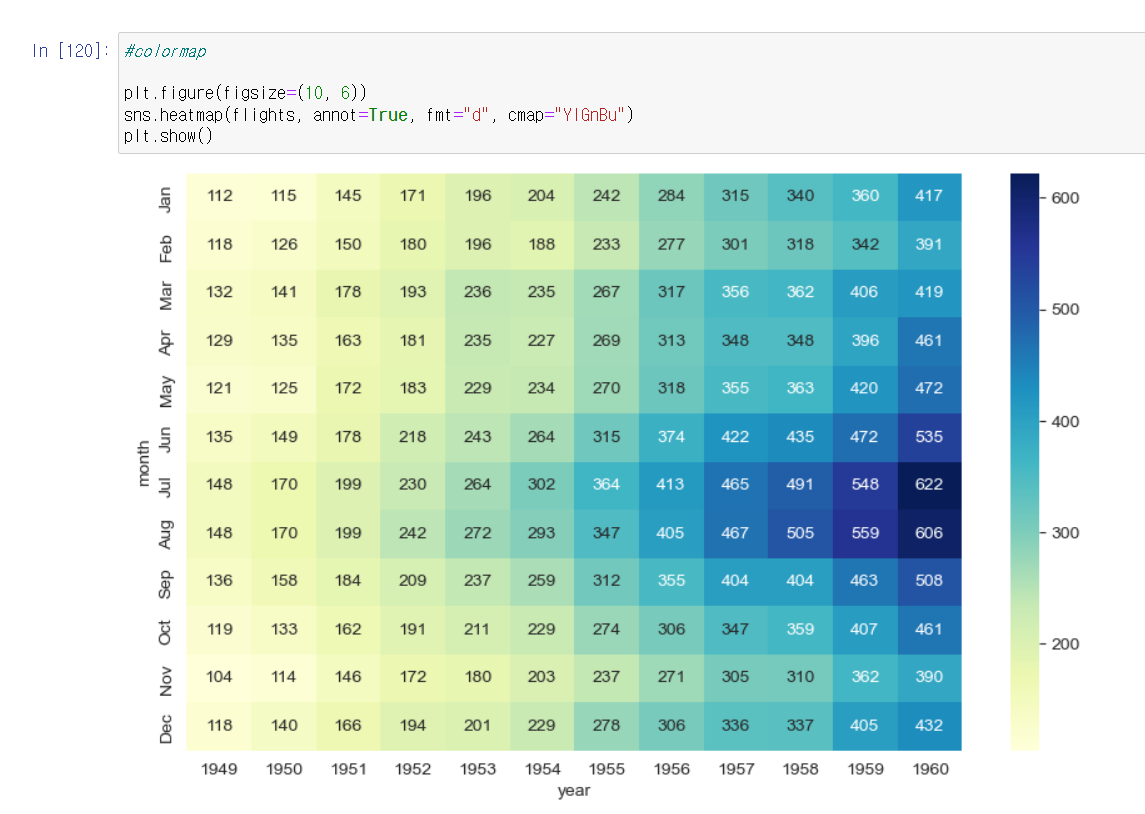
🚩 heatmap
- pivot
- index, columns, values
- heatmap(data, annot, fmt)
- annot=True : 데이터 값 표시
- fmt = "d" 정수형으로 표현, # "f" 실수형로도 가능

- colormap (cmap)
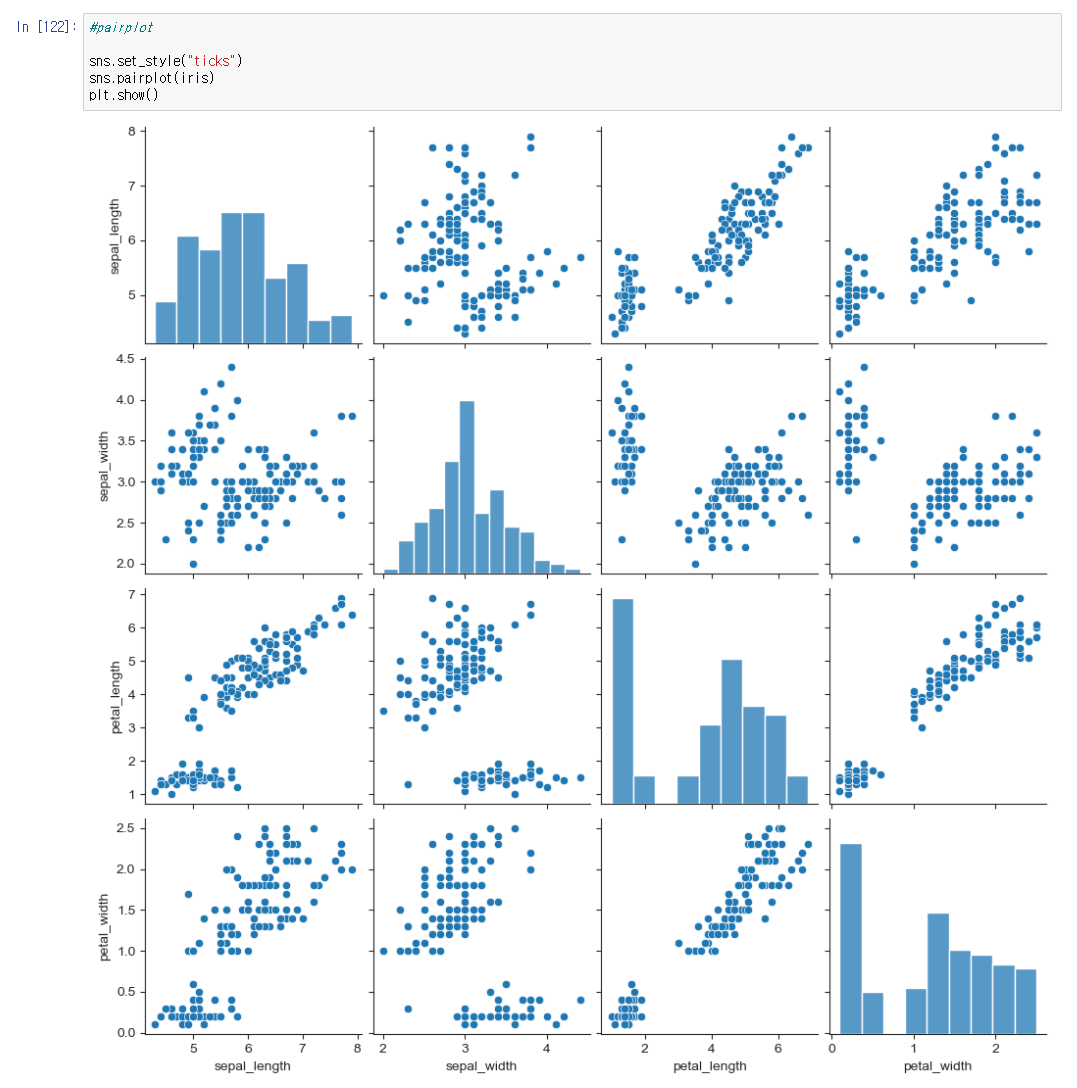
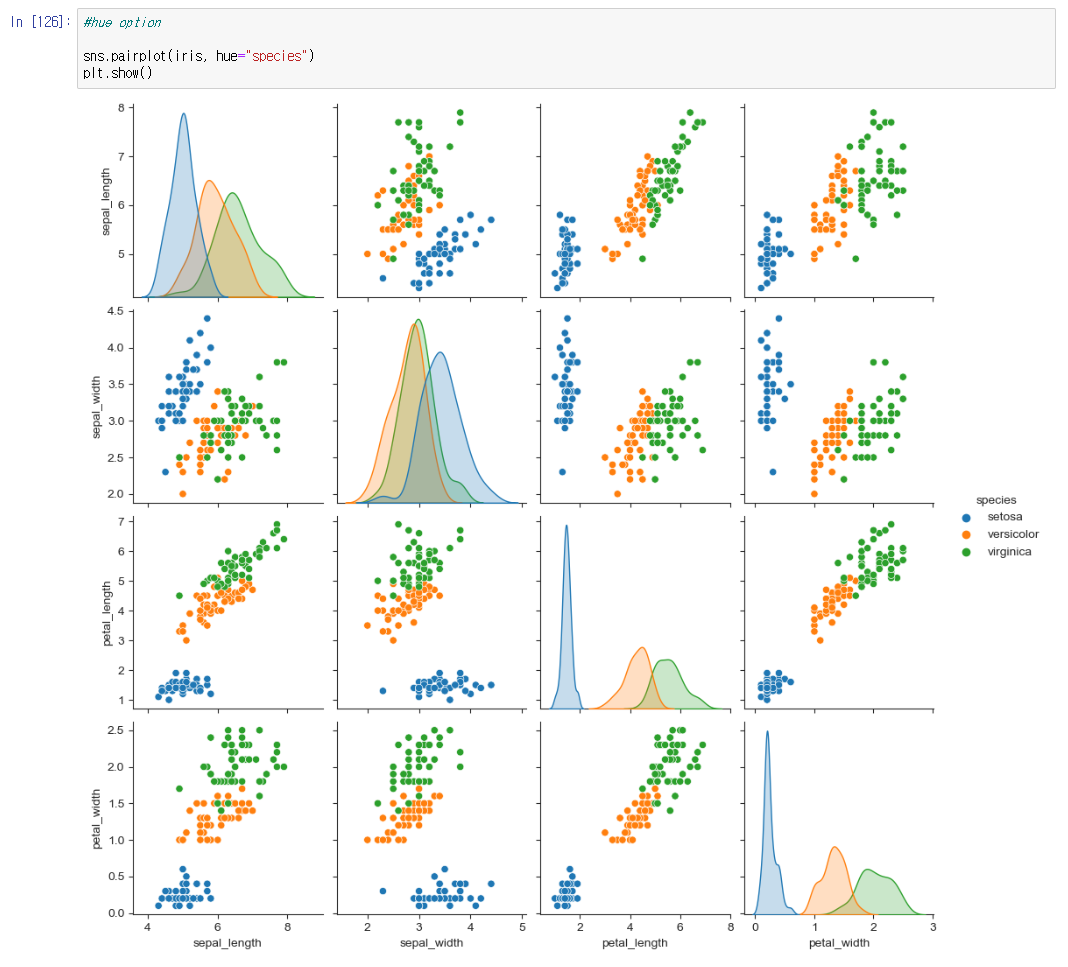
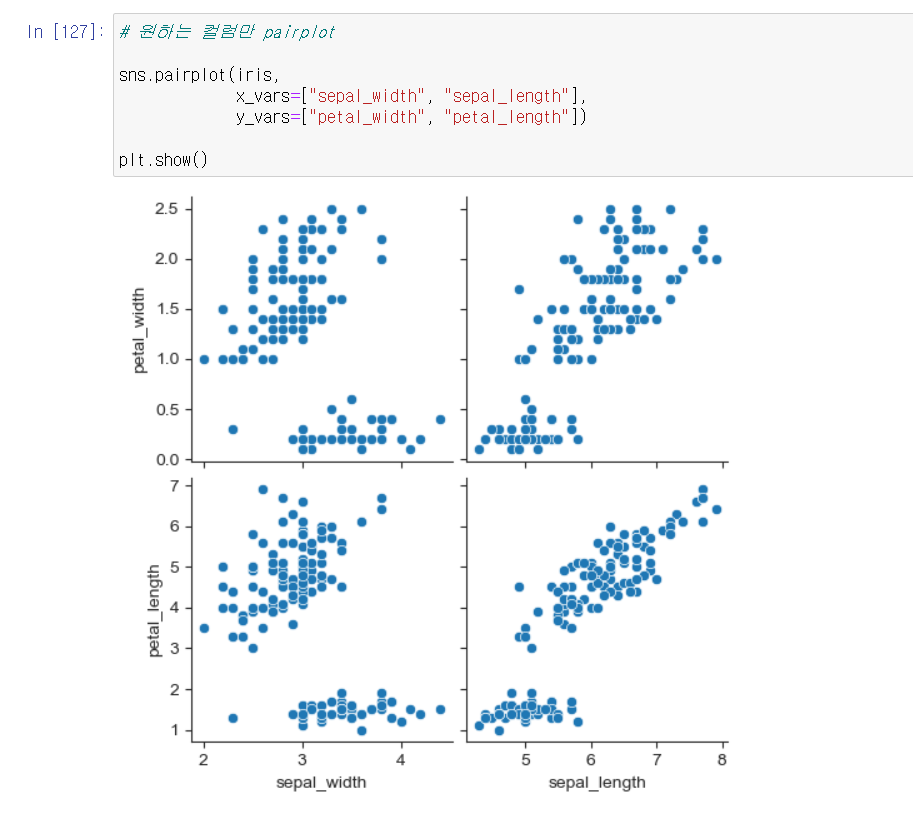
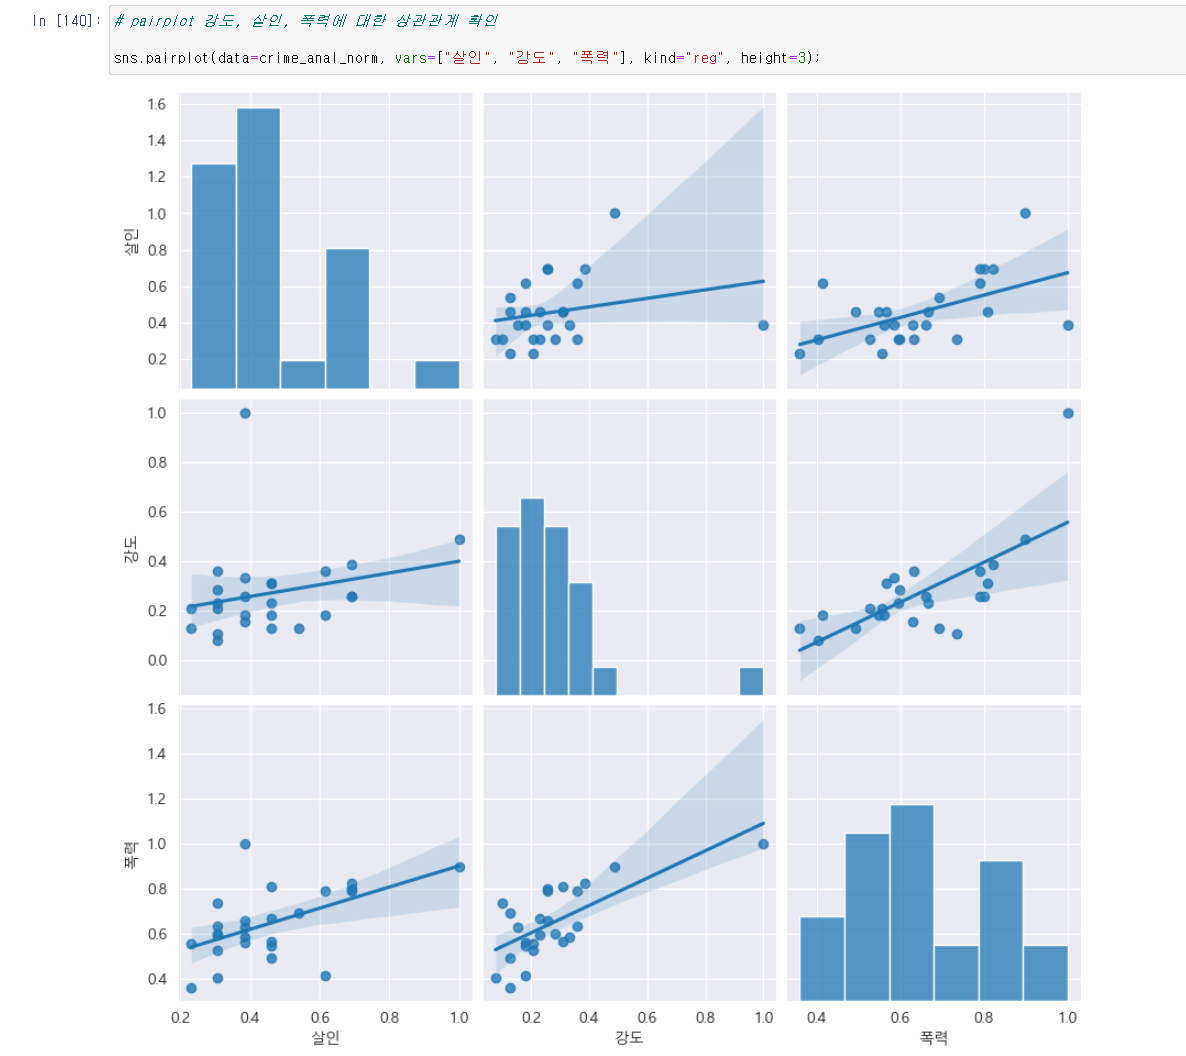
🚩 pairplot
- 전체적인 데이터를 다 보여준다

- 원하는 컬럼만 pairplot으로 표현할 수 있다.
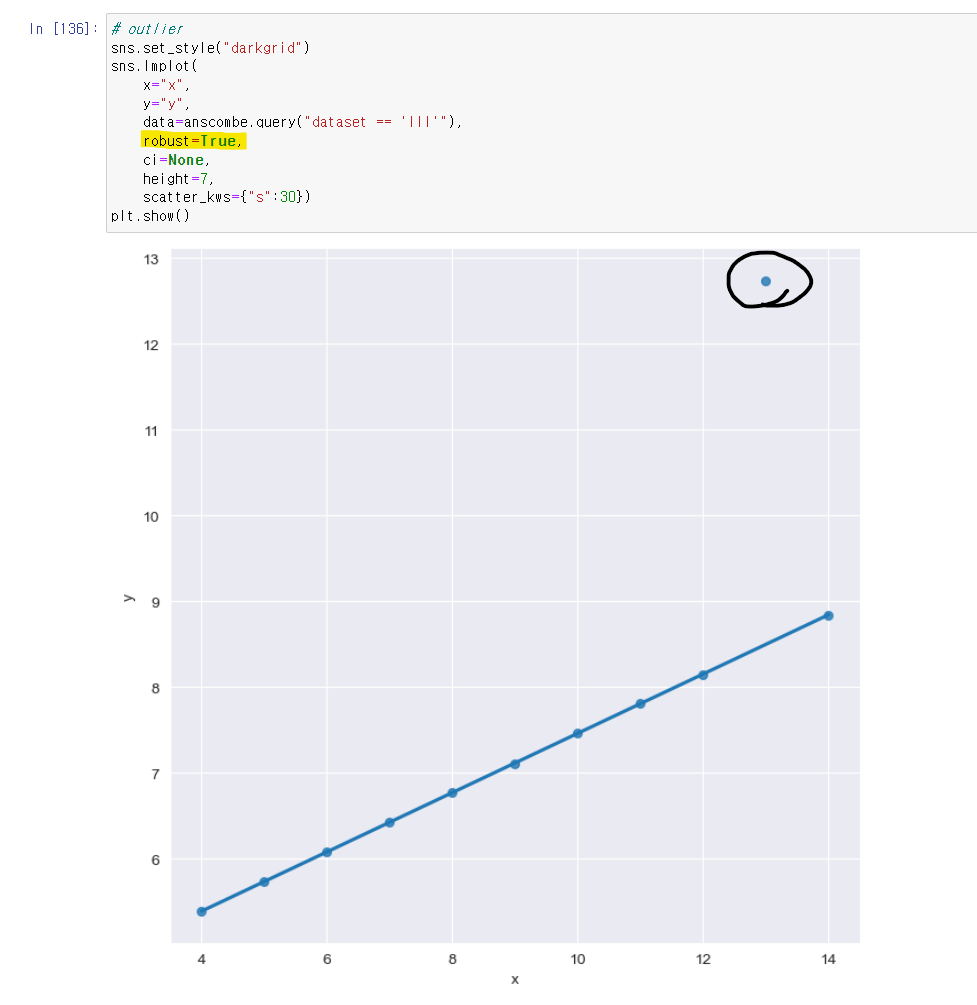
🚩 lmplot
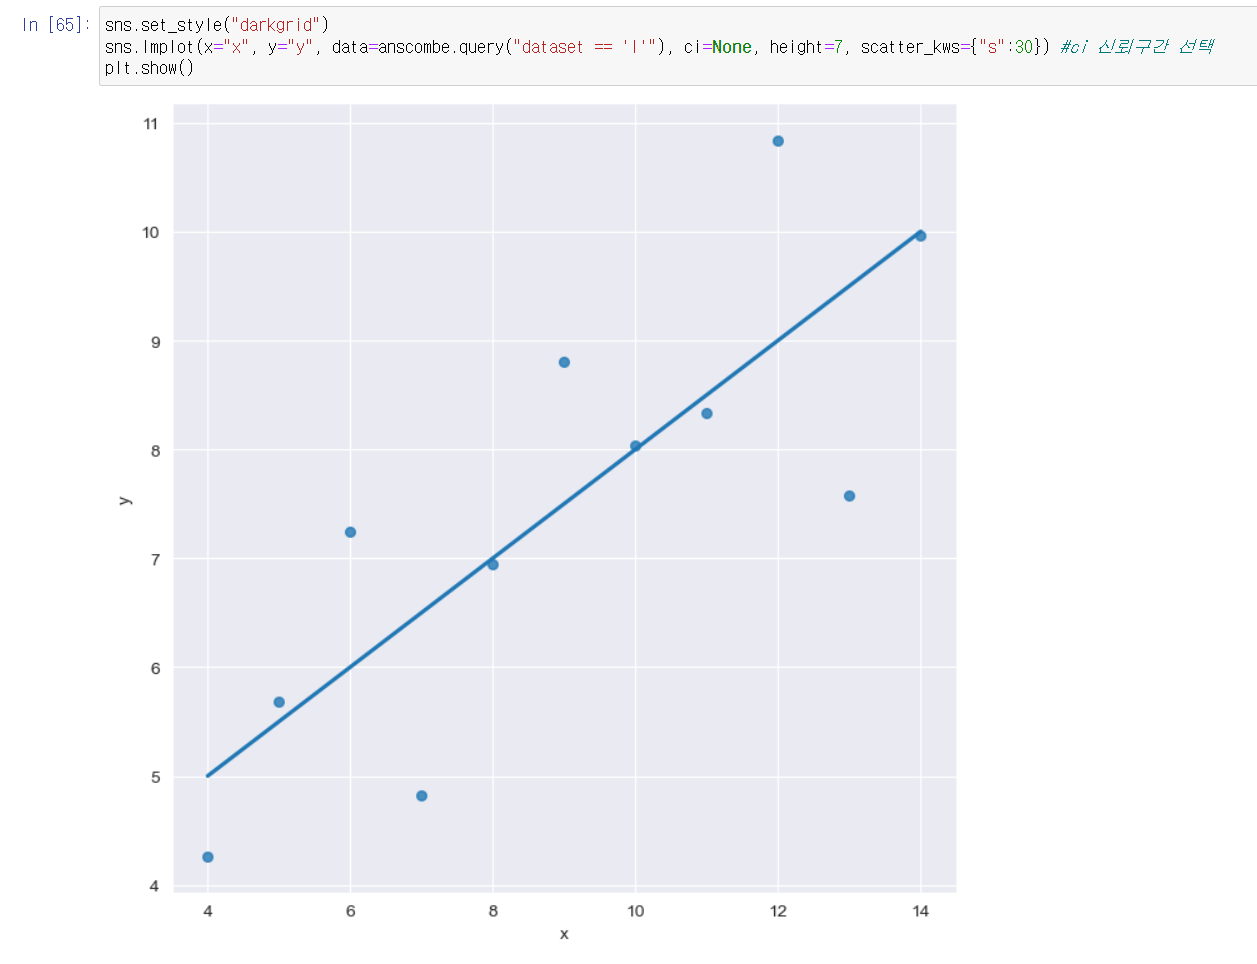
- order option

- outlier
- robust 옵션으로 예외 데이터를 제외하고 출력
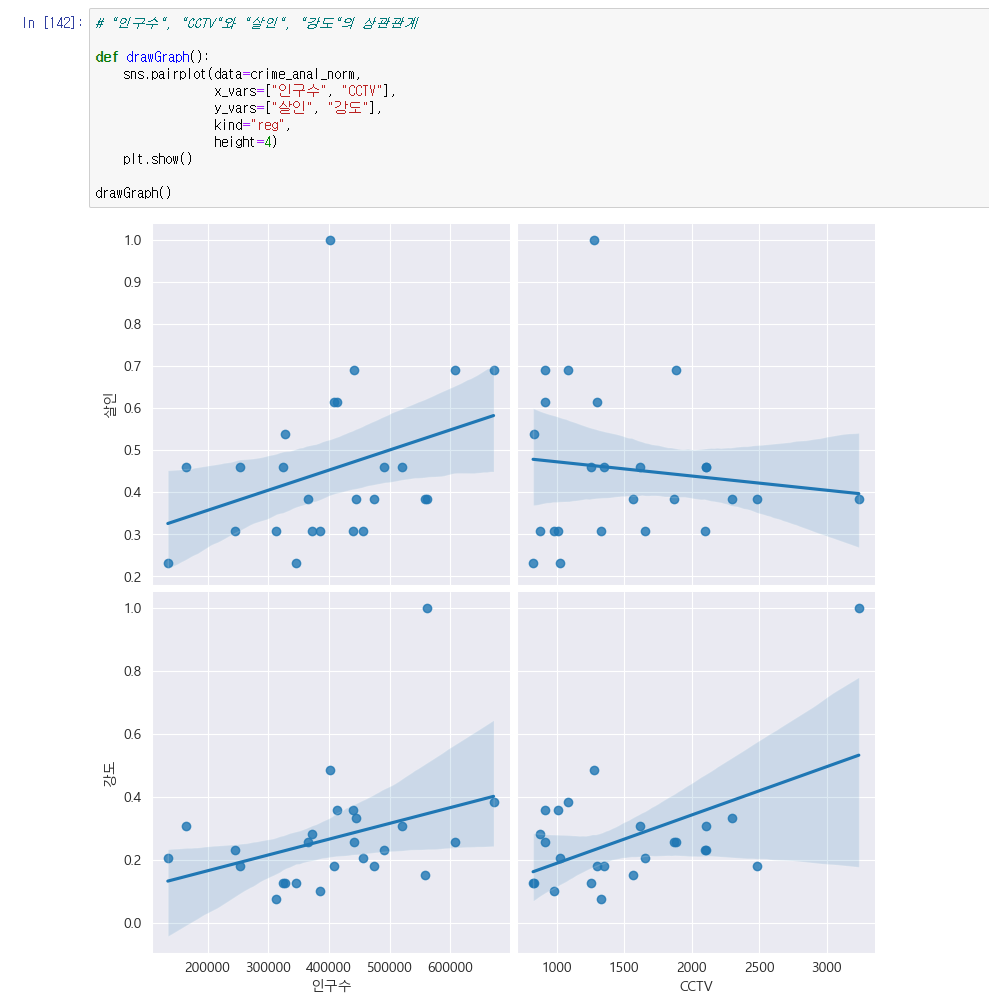
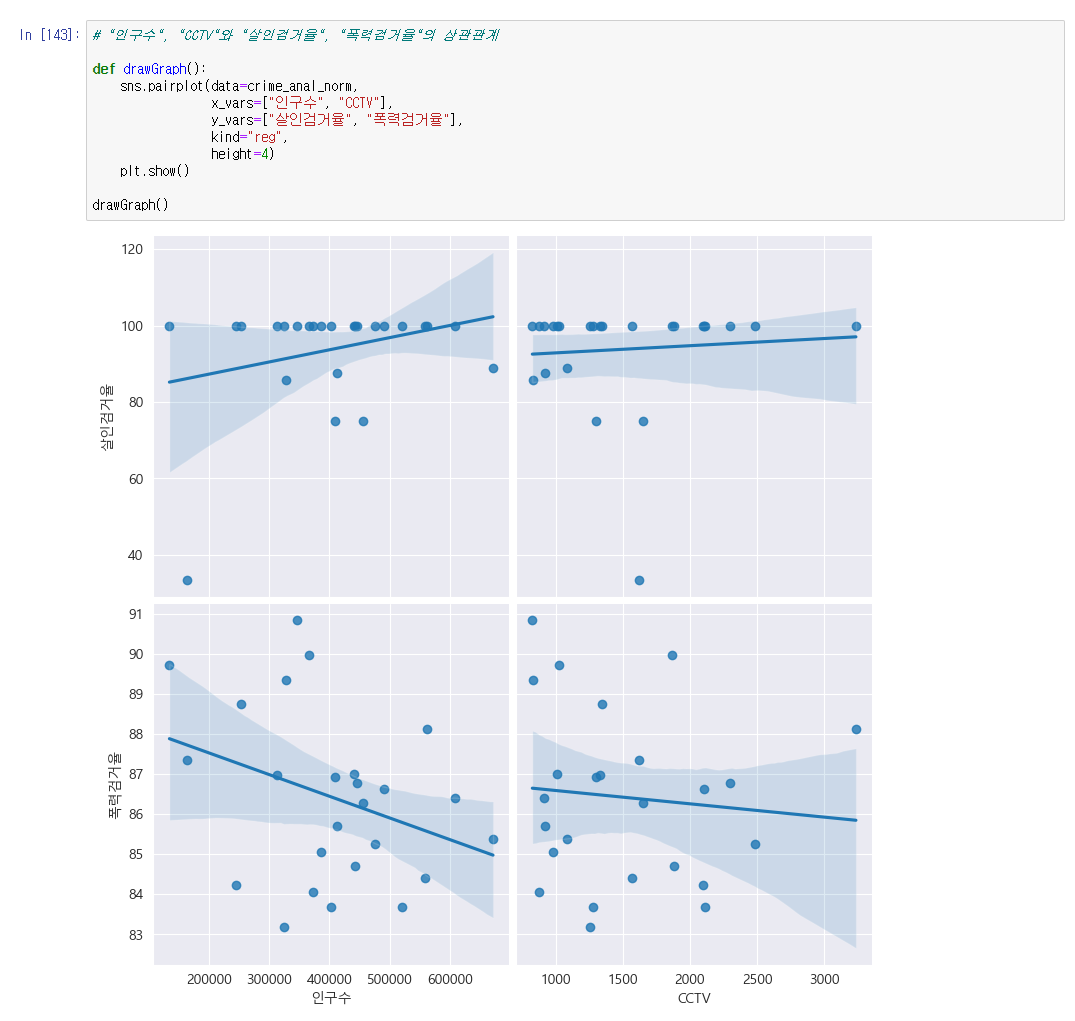
🚩 서울시 범죄현황 데이터 시각화
- vars = x,y 값 데이터를 통합적으로 출력
- x_vars, y_vars 값 출력
🚩 heatmap으로 시각화하기


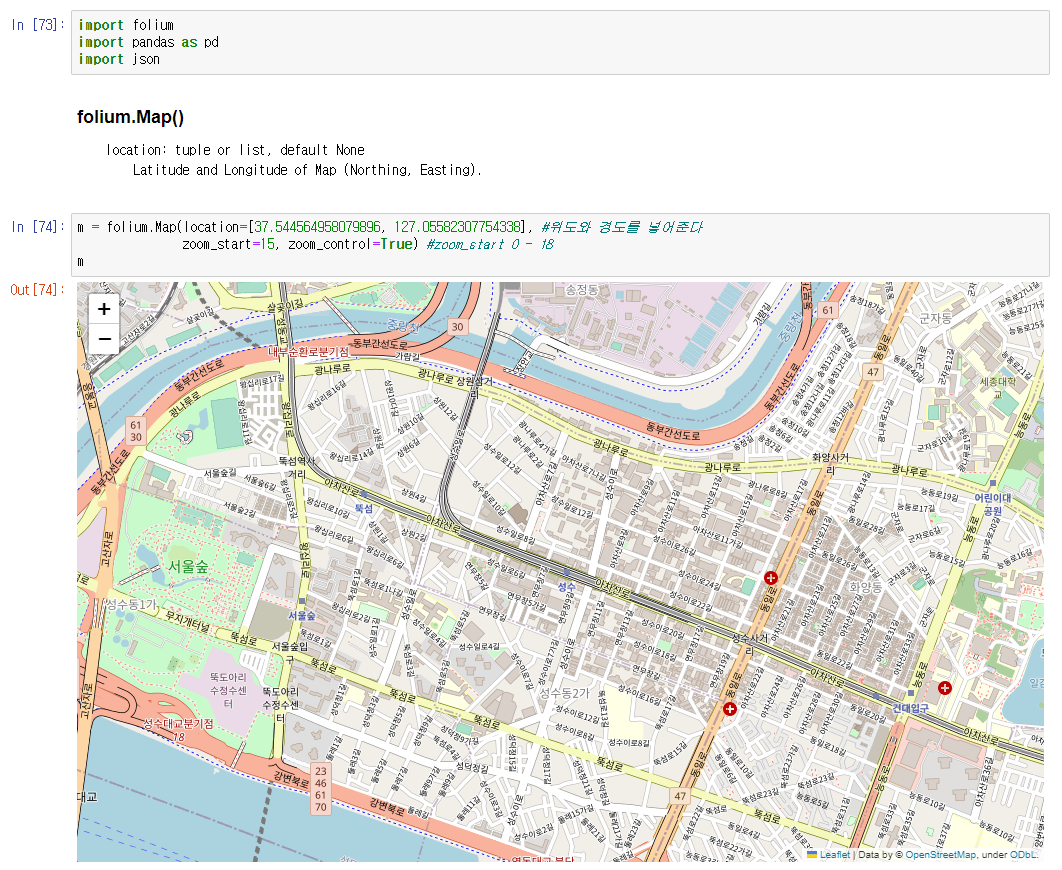
🚩 folium.Map()
- location=[lat, lng]
- zoom_start, zoom_control
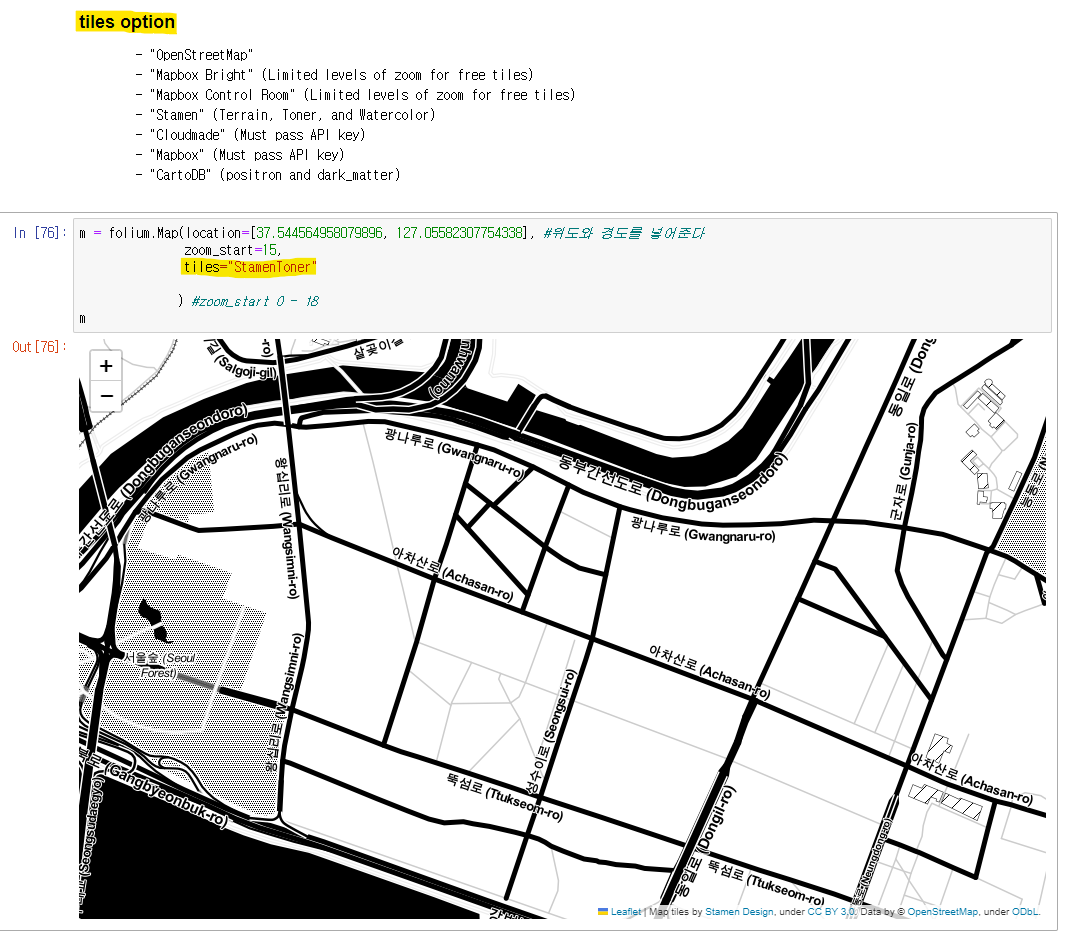
- tiles option
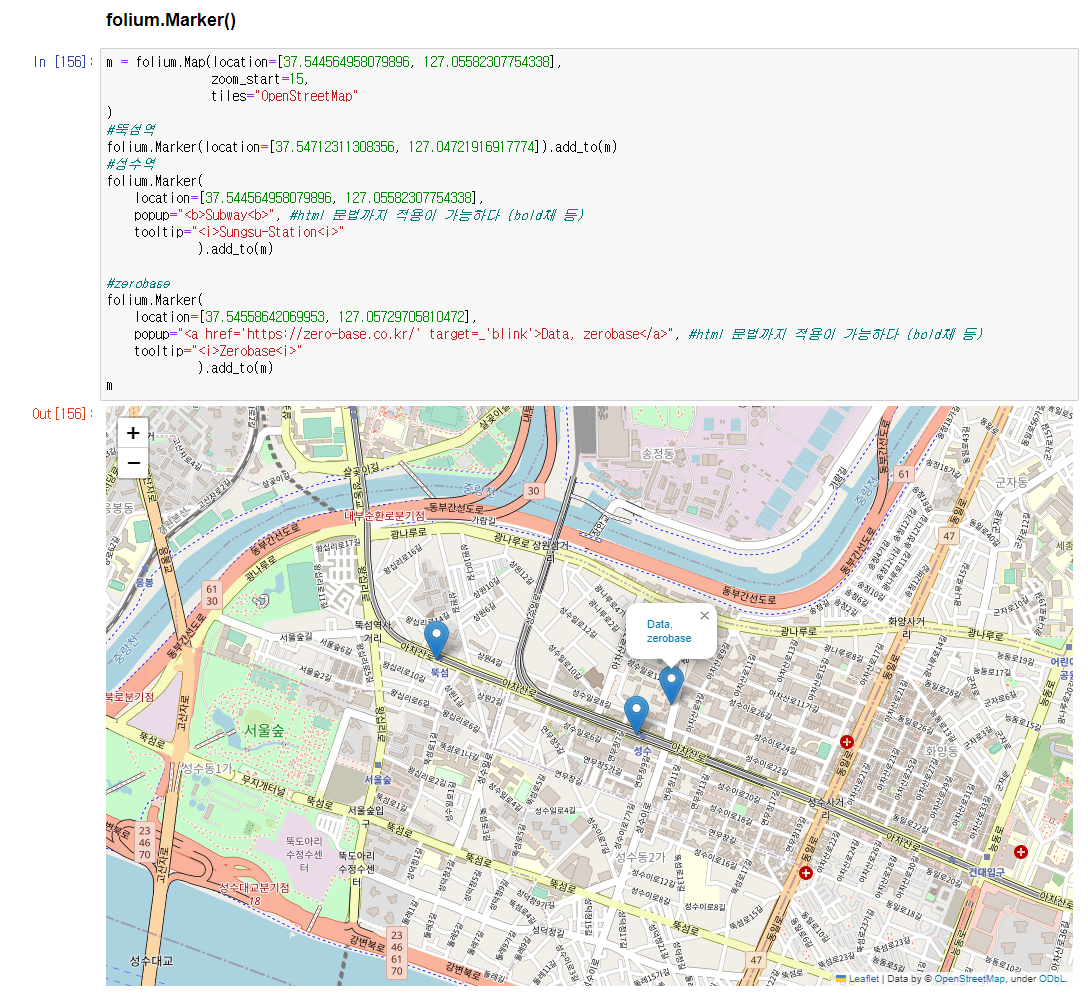
- folium.Marker(location=[lat, lng]).add_to(m)
- popup (클릭시 나오는 창)
- tooltip option (마우스 커서가 닿으면 나오는 창)
- tooltip option, hyperlink 사용 가능
- folium.Icon(color, icon, icon_color, prefix, angle)
- 아이콘을 마음대로 커스텀 할 수 있다

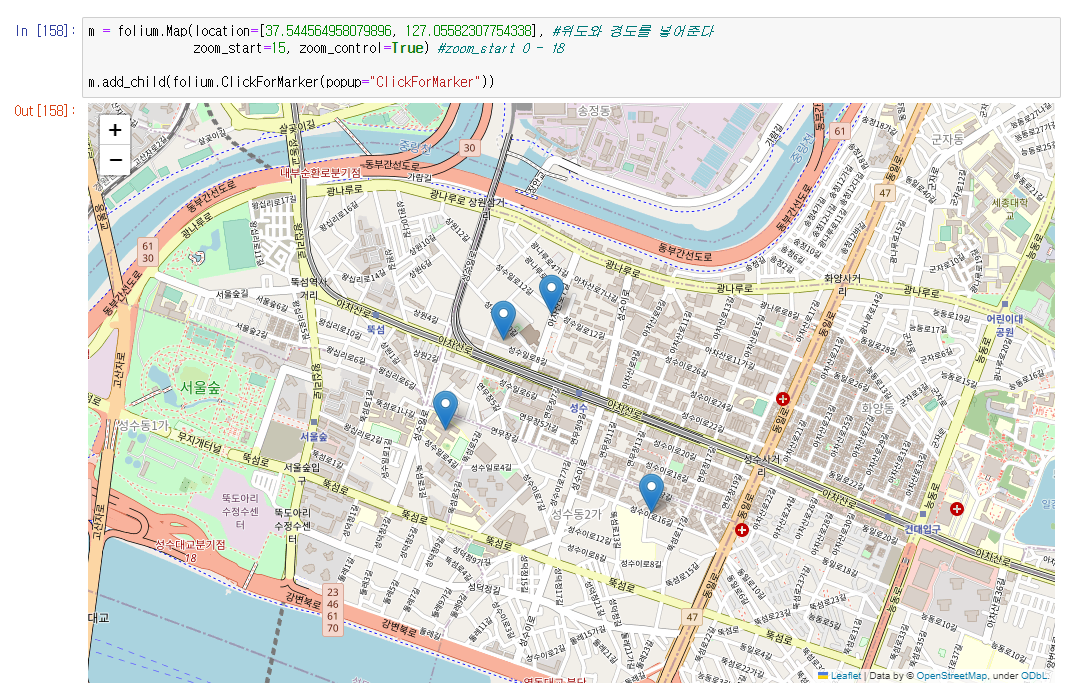
- folium.ClickForMarker()
- 지도위에 마우스 클릭시 마커를 생성
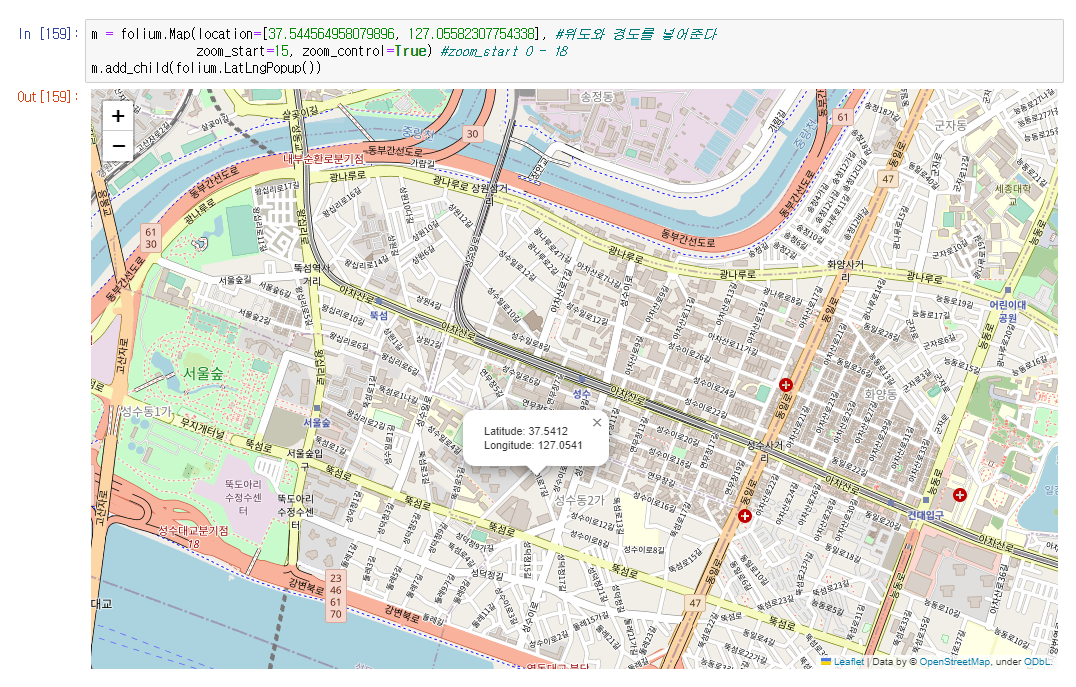
- folium.LatLngPopup()
- 지도 위치 클릭시 위도와 경도 정보 반환
- folium.Circle()
- location, radius, fill, color, fill_color, popup, tooltip
- folium.CircleMarker()
- location, radius, fill, color, fill_color, popup, tooltip

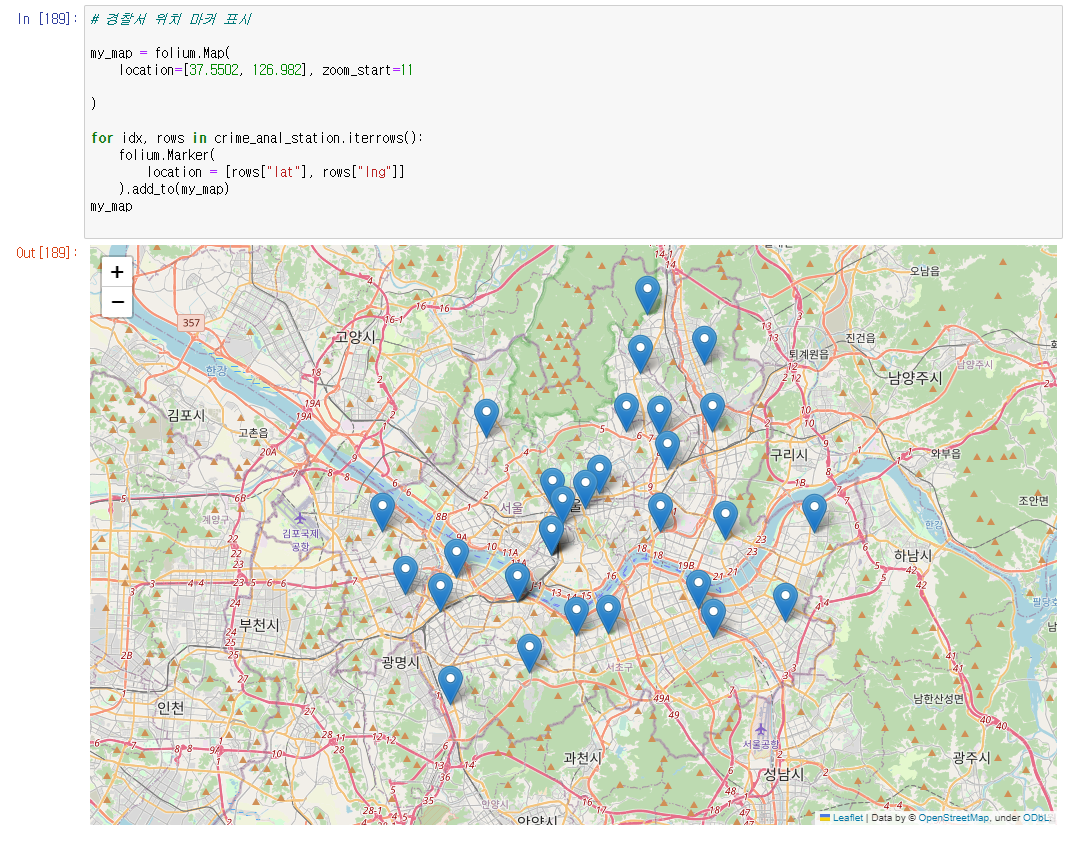
🚩 경찰서 위치 마커 표시
- iterrows 함수를 사용
- rows의 lat, lng 데이터를 사용하여 위치를 표시
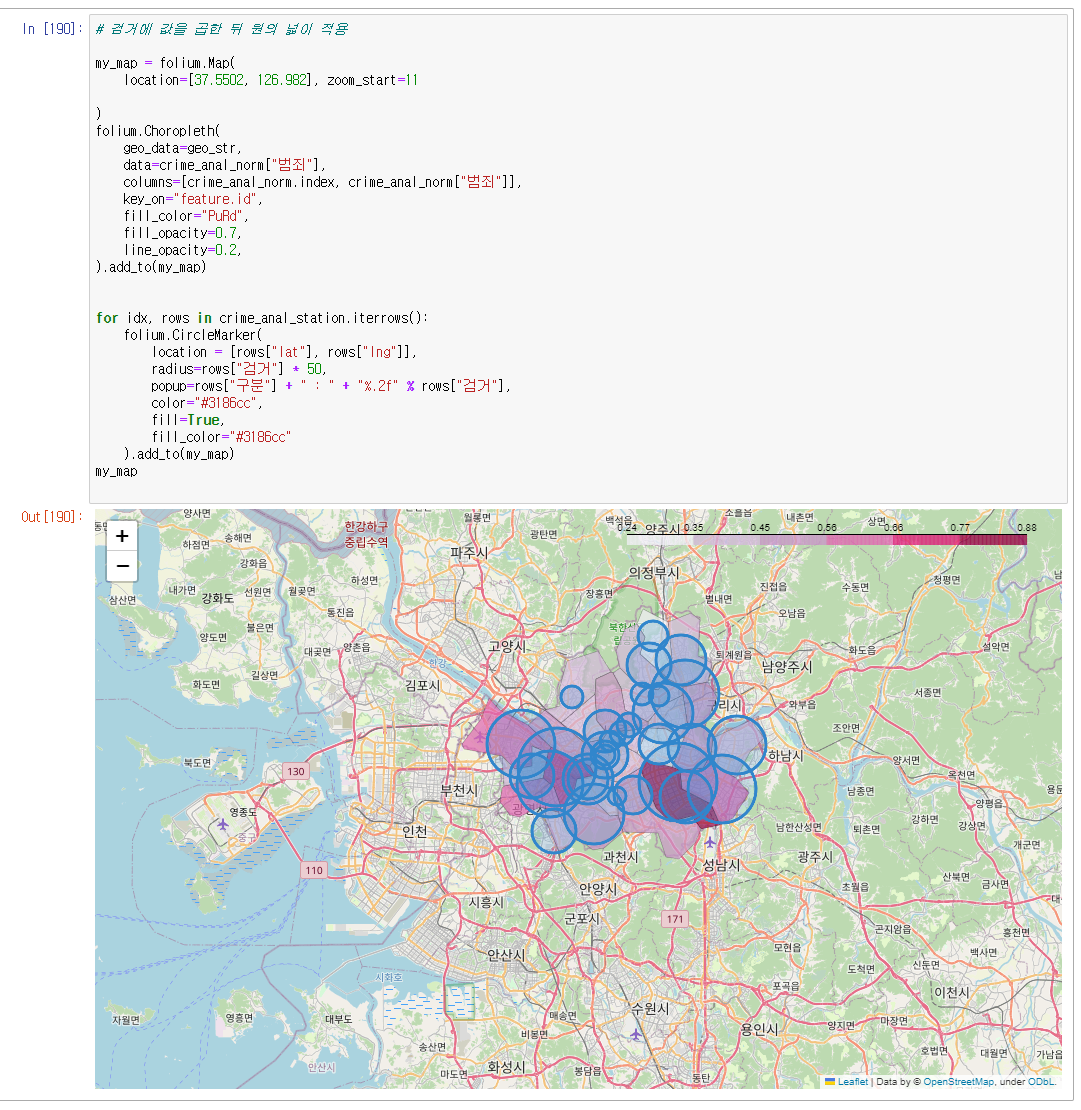
🚩 Choropleth 함수
- 원의 넓이가 클수록 검거율이 높은 곳
'Study_note(zb_data) > EDA' 카테고리의 다른 글
| 스터디 노트 (BeautifulSoup Web data 1) (0) | 2023.08.11 |
|---|---|
| 스터디 노트 (BeautifulSoup basic) (0) | 2023.08.11 |
| 스터디 노트 (Analysis Seoul CCTV with population) (0) | 2023.08.06 |
| 스터디 노트 (EDA) 데이터 합치기, matplotlib 기초 (0) | 2023.08.05 |
| 스터디 노트 (EDA) Pandas 기초 (0) | 2023.08.05 |